B
Seller's Agent in 2024
BRENDA NEEDHAM
FPM PROPERTIES
(904) 497-4200
13 Total Sales
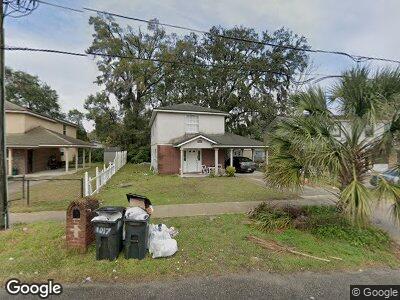
Estimated Value: $196,000 - $213,000
3/2.5 two stories with all bedrooms upstairs. Newer kitchen appliances. Formal dining and living room area. One car carport and small backyard. Resident Amenity Package $25 monthly
| Date | Buyer | Sale Price | Title Company |
|---|---|---|---|
| Meme Livengton | $125,500 | Landmark Title | |
| Johnson Wendy L | $133,000 | Title Clearinghouse |
| Date | Status | Borrower | Loan Amount |
|---|---|---|---|
| Open | Meme Livengton | $132,750 | |
| Closed | Meme Livengton | $94,850 | |
| Previous Owner | Johnson Wendy L | $97,140 | |
| Previous Owner | Johnson Wendy L | $25,000 | |
| Previous Owner | Johnson Wendy L | $17,500 |
| Date | Event | Price | Change | Sq Ft Price |
|---|---|---|---|---|
| 02/28/2024 02/28/24 | For Rent | $1,395 | 0.0% | -- |
| 02/21/2024 02/21/24 | Rented | $1,395 | 0.0% | -- |
| 12/17/2023 12/17/23 | Off Market | $125,500 | -- | -- |
| 12/17/2023 12/17/23 | Off Market | $1,395 | -- | -- |
| 12/17/2023 12/17/23 | Off Market | $1,075 | -- | -- |
| 07/05/2023 07/05/23 | Rented | $1,395 | 0.0% | -- |
| 07/03/2023 07/03/23 | Under Contract | -- | -- | -- |
| 06/08/2023 06/08/23 | For Rent | $1,395 | +29.8% | -- |
| 09/09/2019 09/09/19 | Rented | $1,075 | -17.0% | -- |
| 09/06/2019 09/06/19 | Under Contract | -- | -- | -- |
| 06/25/2019 06/25/19 | For Rent | $1,295 | 0.0% | -- |
| 05/24/2019 05/24/19 | Sold | $125,500 | +0.4% | $78 / Sq Ft |
| 03/27/2019 03/27/19 | Pending | -- | -- | -- |
| 03/22/2019 03/22/19 | For Sale | $125,000 | -- | $78 / Sq Ft |
| Year | Tax Paid | Tax Assessment Tax Assessment Total Assessment is a certain percentage of the fair market value that is determined by local assessors to be the total taxable value of land and additions on the property. | Land | Improvement |
|---|---|---|---|---|
| 2024 | $2,914 | $164,154 | $9,030 | $155,124 |
| 2023 | $2,914 | $162,394 | $9,870 | $152,524 |
| 2022 | $2,548 | $151,078 | $9,870 | $141,208 |
| 2021 | $2,300 | $121,047 | $6,930 | $114,117 |
| 2020 | $2,234 | $116,561 | $6,300 | $110,261 |
| 2019 | $2,220 | $114,101 | $3,780 | $110,321 |
| 2018 | $2,202 | $112,103 | $4,200 | $107,903 |
| 2017 | $2,195 | $110,433 | $4,200 | $106,233 |
| 2016 | $1,038 | $86,935 | $0 | $0 |
| 2015 | $1,046 | $86,331 | $0 | $0 |
| 2014 | $1,045 | $85,646 | $0 | $0 |
B
Seller's Agent in 2024
BRENDA NEEDHAM
FPM PROPERTIES
(904) 497-4200
13 Total Sales

Seller Co-Listing Agent in 2024
Michael Hodges
FPM PROPERTIES
(904) 334-2864
22 Total Sales
Seller's Agent in 2019
MARK CARROLL
ROUND TABLE REALTY
(904) 703-2442
13 Total Sales
T
Seller Co-Listing Agent in 2019
TIMOTHY ENNEVOR
FPM PROPERTIES
Buyer's Agent in 2019
Cristina Comstock
ENGEL & VOLKERS FIRST COAST
(904) 866-3117
43 Total Sales