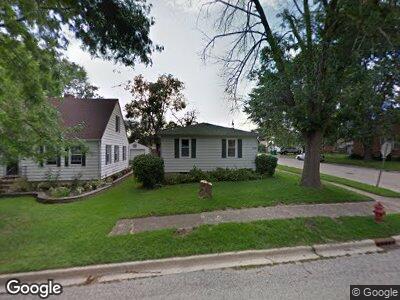
1019 Frederick St Joliet, IL 60435
Cunningham NeighborhoodEstimated Value: $206,000 - $245,000
--
Bed
--
Bath
960
Sq Ft
$234/Sq Ft
Est. Value
About This Home
This home is located at 1019 Frederick St, Joliet, IL 60435 and is currently estimated at $225,036, approximately $234 per square foot. 1019 Frederick St is a home located in Will County with nearby schools including Taft Elementary School, Hufford Junior High School, and Joliet Central High School.
Ownership History
Date
Name
Owned For
Owner Type
Purchase Details
Closed on
Nov 1, 2001
Sold by
Mastin William D and Mastin Abigail E
Bought by
Jeanes Kim
Current Estimated Value
Home Financials for this Owner
Home Financials are based on the most recent Mortgage that was taken out on this home.
Original Mortgage
$93,150
Outstanding Balance
$39,895
Interest Rate
6.72%
Estimated Equity
$183,482
Purchase Details
Closed on
Sep 12, 1997
Sold by
Bennett Joann M
Bought by
Mastin William D and Mastin Abigail E
Home Financials for this Owner
Home Financials are based on the most recent Mortgage that was taken out on this home.
Original Mortgage
$91,769
Interest Rate
7.44%
Mortgage Type
FHA
Purchase Details
Closed on
Nov 18, 1996
Sold by
Ciarlette Karen L and Huntley Karen L
Bought by
Harrigan Joann M and Bennett Joann M
Home Financials for this Owner
Home Financials are based on the most recent Mortgage that was taken out on this home.
Original Mortgage
$73,620
Interest Rate
7.94%
Mortgage Type
FHA
Create a Home Valuation Report for This Property
The Home Valuation Report is an in-depth analysis detailing your home's value as well as a comparison with similar homes in the area
Home Values in the Area
Average Home Value in this Area
Purchase History
| Date | Buyer | Sale Price | Title Company |
|---|---|---|---|
| Jeanes Kim | $103,500 | Chicago Title Insurance Co | |
| Mastin William D | $92,500 | -- | |
| Harrigan Joann M | $78,666 | -- |
Source: Public Records
Mortgage History
| Date | Status | Borrower | Loan Amount |
|---|---|---|---|
| Open | Jeanes Kim | $93,150 | |
| Previous Owner | Mastin William D | $88,812 | |
| Previous Owner | Mastin William D | $91,769 | |
| Previous Owner | Harrigan Joann M | $73,620 |
Source: Public Records
Tax History Compared to Growth
Tax History
| Year | Tax Paid | Tax Assessment Tax Assessment Total Assessment is a certain percentage of the fair market value that is determined by local assessors to be the total taxable value of land and additions on the property. | Land | Improvement |
|---|---|---|---|---|
| 2023 | $3,221 | $61,681 | $9,288 | $52,393 |
| 2022 | $3,797 | $55,795 | $8,402 | $47,393 |
| 2021 | $4,333 | $52,111 | $7,847 | $44,264 |
| 2020 | $4,083 | $49,488 | $7,452 | $42,036 |
| 2019 | $3,843 | $45,993 | $6,926 | $39,067 |
| 2018 | $3,514 | $41,270 | $6,221 | $35,049 |
| 2017 | $3,256 | $37,522 | $5,656 | $31,866 |
| 2016 | $3,026 | $34,158 | $5,207 | $28,951 |
| 2015 | $2,691 | $31,200 | $4,900 | $26,300 |
| 2014 | $2,691 | $31,050 | $4,900 | $26,150 |
| 2013 | $2,691 | $31,833 | $5,453 | $26,380 |
Source: Public Records
Map
Nearby Homes
- 952 Hutchins St
- 1021 Frederick St
- 1007 Frederick St
- 1205 N William St
- 1203 N May St
- 714 Ingalls Ave
- 907 Donnie Ct
- 1306 Waverly Place
- 1206 Catherine St
- 1309 Waverly Place
- 1313 Waverly Place
- 1403 Waverly Place
- 1220 Roosevelt Ave Unit 1
- 903 Wilcox St
- 1226 Plainfield Rd
- 912 Wilcox St
- 813 Junie Ct
- 1107 Highland Ave
- 1304 W Dellmar Ave
- 1218 Highland Ave