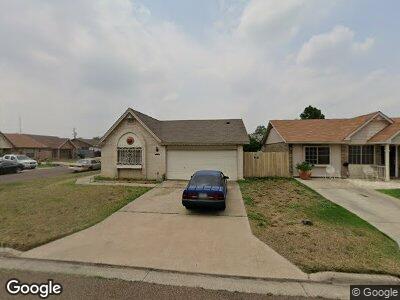
102 Baycliff Ln Laredo, TX 78041
Estimated Value: $178,000 - $217,000
--
Bed
--
Bath
1,575
Sq Ft
$123/Sq Ft
Est. Value
About This Home
This home is located at 102 Baycliff Ln, Laredo, TX 78041 and is currently estimated at $193,172, approximately $122 per square foot. 102 Baycliff Ln is a home located in Webb County with nearby schools including Gutierrez Elementary School, Clark Middle School, and John B. Alexander High School.
Create a Home Valuation Report for This Property
The Home Valuation Report is an in-depth analysis detailing your home's value as well as a comparison with similar homes in the area
Home Values in the Area
Average Home Value in this Area
Tax History Compared to Growth
Tax History
| Year | Tax Paid | Tax Assessment Tax Assessment Total Assessment is a certain percentage of the fair market value that is determined by local assessors to be the total taxable value of land and additions on the property. | Land | Improvement |
|---|---|---|---|---|
| 2024 | $583 | $163,910 | $59,011 | $104,899 |
| 2023 | $3,182 | $160,325 | $29,796 | $130,529 |
| 2022 | $3,318 | $146,132 | $0 | $0 |
| 2021 | $3,415 | $134,319 | $29,811 | $104,508 |
| 2020 | $3,108 | $120,770 | $29,800 | $90,970 |
| 2019 | $3,202 | $121,980 | $29,800 | $92,180 |
| 2018 | $3,059 | $114,980 | $29,320 | $85,660 |
| 2017 | $2,967 | $113,270 | $29,320 | $83,950 |
| 2016 | $2,755 | $105,160 | $23,310 | $81,850 |
| 2015 | $1,929 | $101,980 | $22,260 | $79,720 |
| 2014 | $1,929 | $96,160 | $21,170 | $74,990 |
Source: Public Records
Map
Nearby Homes
- 107 Baycliff Ln
- 504 Gale St Unit C303
- 504 Gale St Unit C304
- 504 Gale Ct Unit D402
- 504 Gale Ct Unit D404
- 504 Gale Ct Unit D403
- 504 Gale Ct Unit B205
- 504 Gale Ct Unit B204
- 504 Gale Ct Unit B203
- 504 Gale Ct Unit B202
- 602 Gale St
- 221 Calle Del Norte
- 119 Kentucky St
- 331 Saint Julien Dr
- 312 Oklahoma St
- 5500 Mcpherson Rd Unit 48
- 5506 Alabama Ave
- 342 Saint Julien Dr
- 406 Jordan Dr
- TBD Jordan Dr