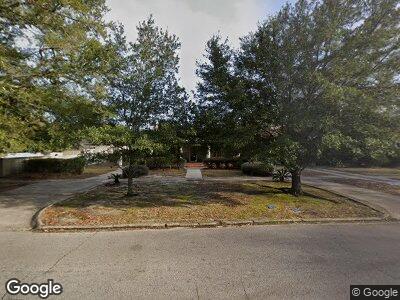
102 Mamie St Hattiesburg, MS 39401
The Oaks NeighborhoodEstimated Value: $299,000 - $511,821
4
Beds
4
Baths
3,114
Sq Ft
$127/Sq Ft
Est. Value
About This Home
This home is located at 102 Mamie St, Hattiesburg, MS 39401 and is currently estimated at $394,455, approximately $126 per square foot. 102 Mamie St is a home located in Forrest County with nearby schools including Woodley Elementary School, N.R. Burger Middle School, and Hattiesburg High School.
Ownership History
Date
Name
Owned For
Owner Type
Purchase Details
Closed on
Dec 15, 2023
Sold by
Griffith Charles R and Hollis James David
Bought by
Griffith Charles R
Current Estimated Value
Home Financials for this Owner
Home Financials are based on the most recent Mortgage that was taken out on this home.
Original Mortgage
$250,000
Outstanding Balance
$186,257
Interest Rate
7.29%
Mortgage Type
New Conventional
Estimated Equity
$220,227
Purchase Details
Closed on
Nov 26, 2018
Sold by
Griffith Charles R
Bought by
Hollis James David and Griffith Charles R
Home Financials for this Owner
Home Financials are based on the most recent Mortgage that was taken out on this home.
Original Mortgage
$840,000
Interest Rate
4.8%
Mortgage Type
Purchase Money Mortgage
Purchase Details
Closed on
Apr 1, 2008
Sold by
Kimes Alvin Craig and Kimes Linda Dianne
Bought by
Griffith Charles R
Create a Home Valuation Report for This Property
The Home Valuation Report is an in-depth analysis detailing your home's value as well as a comparison with similar homes in the area
Home Values in the Area
Average Home Value in this Area
Purchase History
| Date | Buyer | Sale Price | Title Company |
|---|---|---|---|
| Griffith Charles R | -- | None Listed On Document | |
| Hollis James David | -- | -- | |
| Griffith Charles R | -- | -- |
Source: Public Records
Mortgage History
| Date | Status | Borrower | Loan Amount |
|---|---|---|---|
| Open | Griffith Charles R | $250,000 | |
| Previous Owner | Griffith Charles R | $730,287 | |
| Previous Owner | Hollis James David | $840,000 | |
| Previous Owner | Griffith Charles R | $425,000 | |
| Previous Owner | Griffith Charles R | $410,000 | |
| Previous Owner | Griffith Charles R | $344,098 | |
| Previous Owner | Kimes Alvin Craig | $200,000 |
Source: Public Records
Tax History Compared to Growth
Tax History
| Year | Tax Paid | Tax Assessment Tax Assessment Total Assessment is a certain percentage of the fair market value that is determined by local assessors to be the total taxable value of land and additions on the property. | Land | Improvement |
|---|---|---|---|---|
| 2023 | $9,176 | $331,930 | $0 | $0 |
| 2022 | $9,197 | $49,790 | $0 | $0 |
| 2021 | $9,197 | $49,790 | $0 | $0 |
| 2020 | $8,840 | $48,323 | $0 | $0 |
| 2019 | $8,809 | $48,323 | $0 | $0 |
| 2018 | $8,840 | $48,323 | $0 | $0 |
| 2017 | $6,142 | $35,458 | $0 | $0 |
| 2016 | $5,700 | $33,256 | $0 | $0 |
| 2015 | $5,606 | $332,564 | $0 | $0 |
| 2014 | -- | $32,573 | $0 | $0 |
Source: Public Records
Map
Nearby Homes