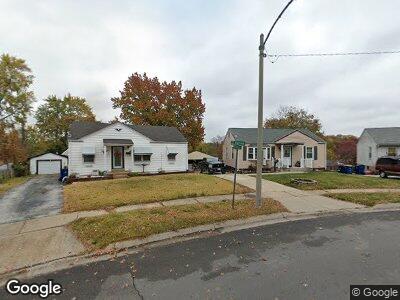
10201 Saint Daniel Ln Saint Ann, MO 63074
Estimated Value: $131,000 - $153,000
2
Beds
1
Bath
792
Sq Ft
$176/Sq Ft
Est. Value
About This Home
This home is located at 10201 Saint Daniel Ln, Saint Ann, MO 63074 and is currently estimated at $139,005, approximately $175 per square foot. 10201 Saint Daniel Ln is a home located in St. Louis County with nearby schools including Buder Elementary School, Hoech Middle School, and Ritenour Senior High School.
Ownership History
Date
Name
Owned For
Owner Type
Purchase Details
Closed on
May 7, 2002
Sold by
22Nd Century Llc
Bought by
Searcy Cheryl A
Current Estimated Value
Home Financials for this Owner
Home Financials are based on the most recent Mortgage that was taken out on this home.
Original Mortgage
$80,275
Interest Rate
7.19%
Purchase Details
Closed on
Nov 20, 2001
Sold by
Winkles Matt L
Bought by
22Nd Century Llc
Home Financials for this Owner
Home Financials are based on the most recent Mortgage that was taken out on this home.
Original Mortgage
$30,750
Interest Rate
7.01%
Purchase Details
Closed on
Oct 26, 2001
Sold by
Sawicki Charlotte E
Bought by
Winkles Matt L
Home Financials for this Owner
Home Financials are based on the most recent Mortgage that was taken out on this home.
Original Mortgage
$30,750
Interest Rate
7.01%
Create a Home Valuation Report for This Property
The Home Valuation Report is an in-depth analysis detailing your home's value as well as a comparison with similar homes in the area
Home Values in the Area
Average Home Value in this Area
Purchase History
| Date | Buyer | Sale Price | Title Company |
|---|---|---|---|
| Searcy Cheryl A | $84,500 | -- | |
| 22Nd Century Llc | $41,000 | -- | |
| Winkles Matt L | $36,000 | First American Title | |
| Sawicki Charlotte E | -- | First American Title |
Source: Public Records
Mortgage History
| Date | Status | Borrower | Loan Amount |
|---|---|---|---|
| Open | Searcy | $66,798 | |
| Closed | Searcy Cheryl A | $80,275 | |
| Previous Owner | 22Nd Century Llc | $30,750 | |
| Previous Owner | Winkles Matt L | $37,000 |
Source: Public Records
Tax History Compared to Growth
Tax History
| Year | Tax Paid | Tax Assessment Tax Assessment Total Assessment is a certain percentage of the fair market value that is determined by local assessors to be the total taxable value of land and additions on the property. | Land | Improvement |
|---|---|---|---|---|
| 2023 | $1,979 | $20,710 | $3,310 | $17,400 |
| 2022 | $1,844 | $17,650 | $3,800 | $13,850 |
| 2021 | $1,843 | $17,650 | $3,800 | $13,850 |
| 2020 | $1,572 | $13,780 | $3,800 | $9,980 |
| 2019 | $1,556 | $13,780 | $3,800 | $9,980 |
| 2018 | $1,531 | $12,200 | $3,270 | $8,930 |
| 2017 | $1,449 | $12,200 | $3,270 | $8,930 |
| 2016 | $1,178 | $10,810 | $3,270 | $7,540 |
| 2015 | $1,205 | $10,810 | $3,270 | $7,540 |
| 2014 | $1,796 | $16,440 | $3,330 | $13,110 |
Source: Public Records
Map
Nearby Homes
- 3214 Krem Ave
- 10220 Baltimore Ave
- 10076 Baltimore Ave
- 10424 Ashby Place Ln
- 3329 Krem Ct
- 2903 Lesmer Ct
- 3000 Ashby Rd
- 3005 Ashby Rd
- 3001 Ashby Rd
- 10515 Clarendon Ave
- 2700 Sims Ave
- 3222 W Tennyson Ave
- 3447 Saint Mark Ln
- 3229 Suncrest Ave
- 10516 Wurdack Ave
- 2747 Wismer Ave
- 3345 Suncrest Ave
- 10318 Pineview Ct
- 10356 Saint Matthew Ln
- 10093 Midland Blvd