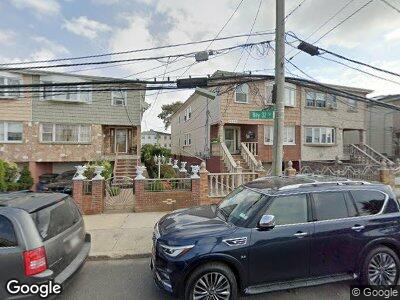
1026 Bay 32nd St Far Rockaway, NY 11691
Bayswater NeighborhoodEstimated Value: $733,000 - $891,000
--
Bed
--
Bath
3,480
Sq Ft
$228/Sq Ft
Est. Value
About This Home
This home is located at 1026 Bay 32nd St, Far Rockaway, NY 11691 and is currently estimated at $793,895, approximately $228 per square foot. 1026 Bay 32nd St is a home located in Queens County with nearby schools including P.S. 104 The Bays Water, Ms 53 Brian Piccolo, and Q319 Village Academy.
Ownership History
Date
Name
Owned For
Owner Type
Purchase Details
Closed on
Nov 10, 1999
Sold by
Gentles Rebecca and Sharp Winston A
Bought by
Shield Millicent
Current Estimated Value
Home Financials for this Owner
Home Financials are based on the most recent Mortgage that was taken out on this home.
Original Mortgage
$224,950
Outstanding Balance
$79,490
Interest Rate
7.86%
Mortgage Type
FHA
Estimated Equity
$766,097
Create a Home Valuation Report for This Property
The Home Valuation Report is an in-depth analysis detailing your home's value as well as a comparison with similar homes in the area
Home Values in the Area
Average Home Value in this Area
Purchase History
| Date | Buyer | Sale Price | Title Company |
|---|---|---|---|
| Shield Millicent | $230,000 | -- |
Source: Public Records
Mortgage History
| Date | Status | Borrower | Loan Amount |
|---|---|---|---|
| Open | Shield Millicent | $40,792 | |
| Open | Shield Millicent | $224,950 |
Source: Public Records
Tax History Compared to Growth
Tax History
| Year | Tax Paid | Tax Assessment Tax Assessment Total Assessment is a certain percentage of the fair market value that is determined by local assessors to be the total taxable value of land and additions on the property. | Land | Improvement |
|---|---|---|---|---|
| 2024 | $7,236 | $36,029 | $8,547 | $27,482 |
| 2023 | $7,182 | $35,758 | $7,745 | $28,013 |
| 2022 | $6,734 | $40,260 | $10,020 | $30,240 |
| 2021 | $6,698 | $43,080 | $10,020 | $33,060 |
| 2020 | $6,355 | $39,960 | $10,020 | $29,940 |
| 2019 | $6,281 | $40,140 | $10,020 | $30,120 |
| 2018 | $6,074 | $29,798 | $9,232 | $20,566 |
| 2017 | $5,731 | $28,112 | $9,640 | $18,472 |
| 2016 | $5,302 | $28,112 | $9,640 | $18,472 |
| 2015 | $3,360 | $25,020 | $8,340 | $16,680 |
| 2014 | $3,360 | $25,020 | $8,340 | $16,680 |
Source: Public Records
Map
Nearby Homes
- 29-64 Falcon Ave
- 29-52 Ocean Crest Blvd
- 32-16 Healy Ave
- 11-12 Bay 32nd Place
- 2918 Beach Channel Dr
- 622 Bay 32 St
- 27-13 Coldspring Rd
- 2713 Coldspring Rd
- 514 Beach 32nd St
- 2918 Brookhaven Ave
- 24-33 Beach Channel Dr
- 27-01 Bayswater Ave
- 538 Beach 43rd St
- 418 Beach 29th St
- 326 Beach 37th St
- 10-31 Dickens St
- 430-432 Beach 43rd St
- 579 Beach 43rd St
- 1118 Bay 24th St
- 515 Beach 43rd St