10268 Liberty Chapel Rd Mount Vernon, OH 43050
Estimated Value: $2,035,800 - $2,100,000
5
Beds
7
Baths
6,230
Sq Ft
$333/Sq Ft
Est. Value
About This Home
This home is located at 10268 Liberty Chapel Rd, Mount Vernon, OH 43050 and is currently estimated at $2,071,600, approximately $332 per square foot. 10268 Liberty Chapel Rd is a home located in Knox County with nearby schools including Mount Vernon High School.
Ownership History
Date
Name
Owned For
Owner Type
Purchase Details
Closed on
Jan 2, 2025
Sold by
Julia Cooper Trust and Cooper Julia A
Bought by
Oasis Ministries
Current Estimated Value
Purchase Details
Closed on
Aug 30, 2021
Sold by
Cooper Julia A
Bought by
Cooper Shane
Purchase Details
Closed on
Jun 17, 2008
Sold by
Precast Service Inc
Bought by
Cooper Barry L
Purchase Details
Closed on
Apr 25, 2007
Sold by
Weiss Lee R
Bought by
Precast Services Inc
Purchase Details
Closed on
Apr 2, 2007
Sold by
Weiss Lee R
Bought by
Goossens Michael L and Goossens Carole R
Purchase Details
Closed on
Apr 21, 1999
Sold by
Blum Andrea
Bought by
Weiss Lee R
Purchase Details
Closed on
Dec 23, 1987
Sold by
Cockerham Alma M and Cockerham Richar
Bought by
Blum Andrea
Create a Home Valuation Report for This Property
The Home Valuation Report is an in-depth analysis detailing your home's value as well as a comparison with similar homes in the area
Home Values in the Area
Average Home Value in this Area
Purchase History
| Date | Buyer | Sale Price | Title Company |
|---|---|---|---|
| Oasis Ministries | $1,750,000 | None Listed On Document | |
| Oasis Ministries | $1,750,000 | None Listed On Document | |
| Cooper Shane | -- | None Available | |
| Cooper Julia A | -- | None Available | |
| Cooper Hunter | -- | None Available | |
| Cooper Julia A | -- | None Available | |
| Cooper Barry L | -- | None Available | |
| Precast Services Inc | $247,950 | None Available | |
| Goossens Michael L | $95,850 | None Available | |
| Weiss Lee R | -- | -- | |
| Blum Andrea | $75,000 | -- |
Source: Public Records
Tax History Compared to Growth
Tax History
| Year | Tax Paid | Tax Assessment Tax Assessment Total Assessment is a certain percentage of the fair market value that is determined by local assessors to be the total taxable value of land and additions on the property. | Land | Improvement |
|---|---|---|---|---|
| 2024 | $13,724 | $321,690 | $80,150 | $241,540 |
| 2023 | $13,724 | $321,690 | $80,150 | $241,540 |
| 2022 | $13,404 | $279,730 | $69,690 | $210,040 |
| 2021 | $13,404 | $279,730 | $69,690 | $210,040 |
| 2020 | $12,964 | $280,830 | $70,790 | $210,040 |
| 2019 | $10,746 | $214,840 | $63,930 | $150,910 |
| 2018 | $10,768 | $214,840 | $63,930 | $150,910 |
| 2017 | $10,413 | $214,840 | $63,930 | $150,910 |
| 2016 | $9,092 | $186,810 | $55,590 | $131,220 |
| 2015 | $13,448 | $186,810 | $55,590 | $131,220 |
| 2014 | $8,311 | $189,470 | $58,250 | $131,220 |
| 2013 | $8,329 | $195,440 | $55,470 | $139,970 |
Source: Public Records
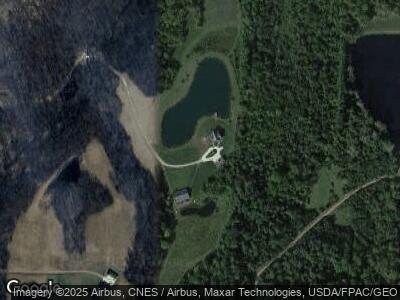
Map
Nearby Homes
- 10160 New Delaware Rd
- 11085 New Delaware Rd
- 10800 Springwater Dr
- 0 Old Delaware Rd Unit 224031381
- 0 Old Delaware Rd Unit 20240525
- 8394 Columbus Rd
- 9177 Green Valley Rd
- 8927 Columbus Road Lot#10
- 8927 Columbus Rd
- 0 Lonzo Ln
- 9169 Kinney Rd
- 900 Harcourt Rd Unit 14
- 7342 Possum St
- 0 Columbus Rd Unit 225001940
- 800 W Gambier St
- 807 W Sugar St
- 204 Maplewood Ave
- 10 Maplewood Ave
- 706 W Chestnut St
- 800 N Sandusky St