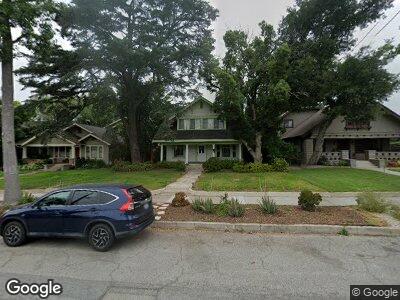
1027 Montrose Ave South Pasadena, CA 91030
Estimated Value: $1,927,537 - $2,465,000
4
Beds
1
Bath
2,314
Sq Ft
$992/Sq Ft
Est. Value
About This Home
This home is located at 1027 Montrose Ave, South Pasadena, CA 91030 and is currently estimated at $2,294,634, approximately $991 per square foot. 1027 Montrose Ave is a home located in Los Angeles County with nearby schools including Marengo Elementary, South Pasadena Middle School, and South Pasadena High School.
Ownership History
Date
Name
Owned For
Owner Type
Purchase Details
Closed on
Dec 15, 2011
Sold by
Lee Chien Chuan and Lee Mei Hwa
Bought by
Lee Mei Hwa
Current Estimated Value
Purchase Details
Closed on
Feb 5, 1996
Sold by
Herrera Jesse J and Herrera Paula K
Bought by
Lee Chien Chuan and Lee Mei Hwa
Home Financials for this Owner
Home Financials are based on the most recent Mortgage that was taken out on this home.
Original Mortgage
$251,587
Interest Rate
7.04%
Create a Home Valuation Report for This Property
The Home Valuation Report is an in-depth analysis detailing your home's value as well as a comparison with similar homes in the area
Home Values in the Area
Average Home Value in this Area
Purchase History
| Date | Buyer | Sale Price | Title Company |
|---|---|---|---|
| Lee Mei Hwa | -- | None Available | |
| Lee Chien Chuan | $335,500 | Guardian Title Company |
Source: Public Records
Mortgage History
| Date | Status | Borrower | Loan Amount |
|---|---|---|---|
| Open | Lee Mei Hwa | $385,000 | |
| Closed | Lee Mei Hwa | $509,000 | |
| Closed | Lee Chien Chuan | $400,000 | |
| Closed | Lee Chien Chuan | $500,000 | |
| Closed | Lee Chien Chuan | $367,500 | |
| Closed | Lee Chien Chuan | $232,500 | |
| Closed | Lee Chien Chuan | $231,657 | |
| Closed | Lee Chien Chuan | $140,000 | |
| Closed | Lee Chien Chuan | $240,000 | |
| Closed | Lee Chien Chuan | $249,400 | |
| Closed | Lee Chien Chuan | $249,400 | |
| Closed | Lee Chen Chuan | $249,400 | |
| Closed | Lee Chien Chuan | $251,587 |
Source: Public Records
Tax History Compared to Growth
Tax History
| Year | Tax Paid | Tax Assessment Tax Assessment Total Assessment is a certain percentage of the fair market value that is determined by local assessors to be the total taxable value of land and additions on the property. | Land | Improvement |
|---|---|---|---|---|
| 2024 | $7,329 | $546,239 | $390,713 | $155,526 |
| 2023 | $7,174 | $535,529 | $383,052 | $152,477 |
| 2022 | $7,008 | $525,030 | $375,542 | $149,488 |
| 2021 | $6,871 | $514,736 | $368,179 | $146,557 |
| 2019 | $6,665 | $499,470 | $357,259 | $142,211 |
| 2018 | $6,451 | $489,677 | $350,254 | $139,423 |
| 2016 | $5,975 | $470,664 | $336,654 | $134,010 |
| 2015 | $5,875 | $463,596 | $331,598 | $131,998 |
| 2014 | $5,803 | $454,516 | $325,103 | $129,413 |
Source: Public Records
Map
Nearby Homes
- 1909 Oxley St
- 1102 Stratford Ave
- 644 Stratford Ave
- 1720 Mission St Unit 11
- 1720 Mission St Unit 21
- 580 Old Mill Rd
- 1520 S Marengo Ave
- 626 Brent Ave
- 2795 Carlaris Rd
- 440 Winthrop Rd
- 770 Huntington Cir
- 812 Fremont Ave Unit 203
- 790 Huntington Cir
- 319 Raymondale Dr
- 1701 Marengo Ave
- 1500 Rollin St
- 1425 Wentworth Ave
- 1112 Hope St
- 1104 Mission St
- 1133 Foothill St