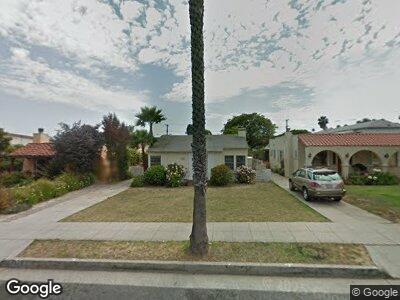
1028 21st St Santa Monica, CA 90403
Wilshire Montana NeighborhoodEstimated Value: $1,600,000 - $2,611,000
4
Beds
3
Baths
1,703
Sq Ft
$1,349/Sq Ft
Est. Value
About This Home
This home is located at 1028 21st St, Santa Monica, CA 90403 and is currently estimated at $2,297,493, approximately $1,349 per square foot. 1028 21st St is a home located in Los Angeles County with nearby schools including Franklin Elementary School, Lincoln Middle School, and Santa Monica High School.
Ownership History
Date
Name
Owned For
Owner Type
Purchase Details
Closed on
Mar 24, 2009
Sold by
Saedi Pirouz Bijan and Saedi Pirouz Vida
Bought by
1028 Twenty First Street Llc
Current Estimated Value
Purchase Details
Closed on
Jun 16, 2003
Sold by
Pirouz Bijan
Bought by
1028 Twenty First Street Llc
Purchase Details
Closed on
Aug 6, 2002
Sold by
Pirouz Bijan
Bought by
Pirouz Bijan and The Bijan & Vida Pirouz Family
Purchase Details
Closed on
Apr 11, 1997
Sold by
Pirouz Vida
Bought by
Pirouz Bijan
Home Financials for this Owner
Home Financials are based on the most recent Mortgage that was taken out on this home.
Original Mortgage
$356,200
Interest Rate
2.82%
Purchase Details
Closed on
Apr 8, 1997
Sold by
Hall Iris
Bought by
Pirouz Bijan
Home Financials for this Owner
Home Financials are based on the most recent Mortgage that was taken out on this home.
Original Mortgage
$356,200
Interest Rate
2.82%
Create a Home Valuation Report for This Property
The Home Valuation Report is an in-depth analysis detailing your home's value as well as a comparison with similar homes in the area
Home Values in the Area
Average Home Value in this Area
Purchase History
| Date | Buyer | Sale Price | Title Company |
|---|---|---|---|
| 1028 Twenty First Street Llc | -- | None Available | |
| 1028 Twenty First Street Llc | -- | -- | |
| Pirouz Bijan | -- | -- | |
| Pirouz Bijan | -- | Progressive Title Company | |
| Pirouz Bijan | $475,000 | -- |
Source: Public Records
Mortgage History
| Date | Status | Borrower | Loan Amount |
|---|---|---|---|
| Previous Owner | Pirouz Bijan | $25,000 | |
| Previous Owner | Pirouz Bijan | $356,200 |
Source: Public Records
Tax History Compared to Growth
Tax History
| Year | Tax Paid | Tax Assessment Tax Assessment Total Assessment is a certain percentage of the fair market value that is determined by local assessors to be the total taxable value of land and additions on the property. | Land | Improvement |
|---|---|---|---|---|
| 2024 | $16,028 | $1,292,801 | $1,040,307 | $252,494 |
| 2023 | $15,770 | $1,267,453 | $1,019,909 | $247,544 |
| 2022 | $15,565 | $1,242,602 | $999,911 | $242,691 |
| 2021 | $15,170 | $1,218,238 | $980,305 | $237,933 |
| 2020 | $15,066 | $1,205,748 | $970,254 | $235,494 |
| 2019 | $14,910 | $1,182,107 | $951,230 | $230,877 |
| 2018 | $13,974 | $1,158,929 | $932,579 | $226,350 |
| 2016 | $13,462 | $1,113,928 | $896,367 | $217,561 |
| 2015 | $13,285 | $1,097,197 | $882,903 | $214,294 |
| 2014 | $13,115 | $1,075,706 | $865,609 | $210,097 |
Source: Public Records
Map
Nearby Homes
- 945 21st St Unit 12
- 1055 19th St Unit 2
- 939 20th St Unit 1
- 1024 23rd St
- 1130 22nd St
- 943 19th St
- 927 20th St Unit A
- 918 22nd St
- 1132 19th St Unit 2
- 1228 21st St Unit A
- 840 20th St Unit 15
- 1133 24th St Unit 10
- 2002 Montana Ave
- 2213 Arizona Ave
- 840 18th St
- 823 18th St
- 1013 16th St Unit 101
- 1227 24th St Unit D
- 918 17th St Unit 2
- 1231 24th St Unit 3