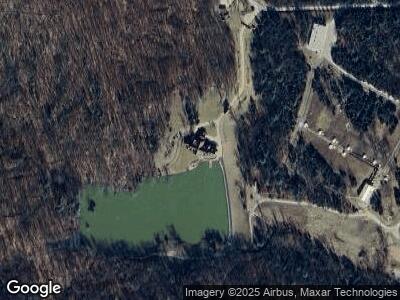
10285 W Youth Camp Rd Columbus, IN 47201
Estimated Value: $1,914,000 - $3,859,511
6
Beds
11
Baths
18,658
Sq Ft
$155/Sq Ft
Est. Value
About This Home
This home is located at 10285 W Youth Camp Rd, Columbus, IN 47201 and is currently estimated at $2,886,756, approximately $154 per square foot. 10285 W Youth Camp Rd is a home located in Bartholomew County with nearby schools including Southside Elementary School, Central Middle School, and Columbus North High School.
Create a Home Valuation Report for This Property
The Home Valuation Report is an in-depth analysis detailing your home's value as well as a comparison with similar homes in the area
Home Values in the Area
Average Home Value in this Area
Tax History Compared to Growth
Tax History
| Year | Tax Paid | Tax Assessment Tax Assessment Total Assessment is a certain percentage of the fair market value that is determined by local assessors to be the total taxable value of land and additions on the property. | Land | Improvement |
|---|---|---|---|---|
| 2024 | $46,175 | $4,871,400 | $61,000 | $4,810,400 |
| 2023 | $46,175 | $4,155,000 | $61,000 | $4,094,000 |
| 2022 | $49,561 | $4,158,500 | $61,000 | $4,097,500 |
| 2021 | $45,932 | $3,779,500 | $61,000 | $3,718,500 |
| 2020 | $46,434 | $3,822,600 | $61,000 | $3,761,600 |
| 2019 | $40,253 | $3,556,100 | $61,000 | $3,495,100 |
| 2018 | $37,918 | $3,441,200 | $61,000 | $3,380,200 |
| 2017 | $40 | $3,509,300 | $58,500 | $3,450,800 |
| 2016 | $38,339 | $3,545,200 | $58,500 | $3,486,700 |
| 2014 | $42,978 | $3,677,300 | $79,500 | $3,597,800 |
Source: Public Records
Map
Nearby Homes
- 10313 W 225 S
- 9398 W Mirror Rd
- 9454 Raintree Dr S
- 0 S State Road 135 Unit MBR22023585
- 3011 S 550 W
- 8494 W Mulligan Ln
- 11741 W Grandview Dr
- 4161 S Summit Ln
- 0 Whitehorse Rd
- 00 W Old Nashville Rd
- 5010 S 550 W
- 8850 W State Road 46
- 13306 W 50 S
- 7027 Pinnacle Dr
- 7055 Scarborough Ct
- 5181 S Poplar Dr
- 897 Westcreek Dr
- 1032 Westview Point Dr
- 0 W State Road 46 Unit MBR22033052
- 368 Westbrook Ct