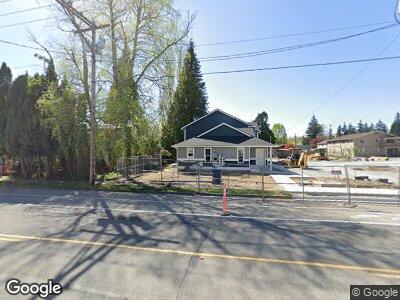
1029 Cedar Ave Marysville, WA 98270
Downtown Marysville NeighborhoodEstimated Value: $275,170
3
Beds
3
Baths
7,769
Sq Ft
$35/Sq Ft
Est. Value
About This Home
This home is located at 1029 Cedar Ave, Marysville, WA 98270 and is currently priced at $275,170, approximately $35 per square foot. 1029 Cedar Ave is a home located in Snohomish County.
Ownership History
Date
Name
Owned For
Owner Type
Purchase Details
Closed on
Aug 15, 2017
Sold by
Sandy Creek Llc
Bought by
Ipso Facto Llc
Current Estimated Value
Purchase Details
Closed on
May 26, 2015
Sold by
Glunt Matthew C and Glunt Cynthia L W
Bought by
Sandy Creek Llc
Home Financials for this Owner
Home Financials are based on the most recent Mortgage that was taken out on this home.
Original Mortgage
$124,000
Interest Rate
3.64%
Mortgage Type
Commercial
Purchase Details
Closed on
Mar 28, 2002
Sold by
Huglen Michial D and Huglen Tammy L
Bought by
Glunt Matthew C and Glunt Cynthia L W
Home Financials for this Owner
Home Financials are based on the most recent Mortgage that was taken out on this home.
Original Mortgage
$126,825
Interest Rate
6.84%
Mortgage Type
Commercial
Purchase Details
Closed on
Aug 22, 1994
Sold by
Jones George A and Jones Marie C
Bought by
Huglen Michial D and Huglen Tammy L
Home Financials for this Owner
Home Financials are based on the most recent Mortgage that was taken out on this home.
Original Mortgage
$93,456
Interest Rate
8.8%
Mortgage Type
FHA
Create a Home Valuation Report for This Property
The Home Valuation Report is an in-depth analysis detailing your home's value as well as a comparison with similar homes in the area
Home Values in the Area
Average Home Value in this Area
Purchase History
| Date | Buyer | Sale Price | Title Company |
|---|---|---|---|
| Ipso Facto Llc | $174,000 | Wfg Natl Title Co Of Wa Llc | |
| Sandy Creek Llc | $155,000 | Fidelity Natl Title Co Of Wa | |
| Glunt Matthew C | $133,500 | Chicago Title Insurance Co | |
| Huglen Michial D | $94,000 | Stewart Title Company |
Source: Public Records
Mortgage History
| Date | Status | Borrower | Loan Amount |
|---|---|---|---|
| Open | Ipso Facto Llc | $3,380,000 | |
| Previous Owner | Sandy Creek Llc | $124,000 | |
| Previous Owner | Glunt Matthew C | $126,825 | |
| Previous Owner | Huglen Michial D | $93,456 |
Source: Public Records
Tax History Compared to Growth
Tax History
| Year | Tax Paid | Tax Assessment Tax Assessment Total Assessment is a certain percentage of the fair market value that is determined by local assessors to be the total taxable value of land and additions on the property. | Land | Improvement |
|---|---|---|---|---|
| 2025 | $26,509 | $4,294,100 | $332,800 | $3,961,300 |
| 2024 | $26,509 | $3,333,000 | $325,400 | $3,007,600 |
| 2023 | $3,917 | $656,500 | $310,400 | $346,100 |
| 2022 | $2,845 | $281,600 | $252,000 | $29,600 |
| 2020 | $2,463 | $223,000 | $176,800 | $46,200 |
| 2019 | $1,923 | $210,400 | $167,800 | $42,600 |
| 2018 | $2,115 | $182,900 | $134,200 | $48,700 |
| 2017 | $1,696 | $150,000 | $134,200 | $15,800 |
| 2016 | $1,825 | $155,000 | $127,800 | $27,200 |
| 2015 | $1,957 | $155,000 | $124,100 | $30,900 |
| 2013 | $1,725 | $130,000 | $124,100 | $5,900 |
Source: Public Records
Map
Nearby Homes
- 1081 Cedar Ave
- 1123 6th St
- 1238 Ash Ave
- 1226 6th St
- 936 Alder Ave
- 21225 RS Undisclosed
- 4000 76th St NE Unit 20
- 1333 Beach Ave Unit 5
- 1895 Liberty Ln
- 942 Union Ave
- 1905 Grove St
- 1620 3rd St
- 7508 47th Ave NE Unit 28
- 1396 Cedar Ave
- 6506 Armar Rd
- 4827 67th St NE Unit A203
- 6511 Armar Rd
- 4805 76th St NE Unit 53
- 4214 84th St NE Unit 10
- 4828 80th St NE