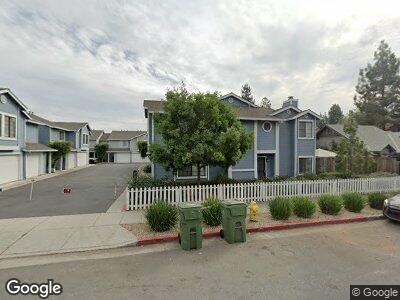
103 Colonade Square San Jose, CA 95127
Alum Rock NeighborhoodEstimated Value: $707,000 - $799,599
3
Beds
3
Baths
1,220
Sq Ft
$617/Sq Ft
Est. Value
About This Home
This home is located at 103 Colonade Square, San Jose, CA 95127 and is currently estimated at $752,650, approximately $616 per square foot. 103 Colonade Square is a home located in Santa Clara County with nearby schools including Lyndale Elementary School, William Sheppard Middle School, and James Lick High School.
Ownership History
Date
Name
Owned For
Owner Type
Purchase Details
Closed on
Dec 31, 2014
Sold by
Villareal Maria R
Bought by
Villarreal Maria R
Current Estimated Value
Home Financials for this Owner
Home Financials are based on the most recent Mortgage that was taken out on this home.
Original Mortgage
$5,600,000
Outstanding Balance
$4,215,238
Interest Rate
2.66%
Mortgage Type
Reverse Mortgage Home Equity Conversion Mortgage
Estimated Equity
-$3,466,035
Purchase Details
Closed on
Jul 2, 2012
Sold by
Villarreal Maria R
Bought by
Villarreal Maria
Home Financials for this Owner
Home Financials are based on the most recent Mortgage that was taken out on this home.
Original Mortgage
$151,000
Interest Rate
3.7%
Mortgage Type
New Conventional
Purchase Details
Closed on
Aug 21, 2009
Sold by
Villarreal Maria
Bought by
Maria Villarreal 2009 Revocable Trust
Home Financials for this Owner
Home Financials are based on the most recent Mortgage that was taken out on this home.
Original Mortgage
$180,000
Interest Rate
5.25%
Mortgage Type
Unknown
Create a Home Valuation Report for This Property
The Home Valuation Report is an in-depth analysis detailing your home's value as well as a comparison with similar homes in the area
Home Values in the Area
Average Home Value in this Area
Purchase History
| Date | Buyer | Sale Price | Title Company |
|---|---|---|---|
| Villarreal Maria R | -- | Tsi Title Company | |
| Villarreal Maria | -- | Old Republic Title Company | |
| Maria Villarreal 2009 Revocable Trust | -- | None Available |
Source: Public Records
Mortgage History
| Date | Status | Borrower | Loan Amount |
|---|---|---|---|
| Open | Villarreal Maria R | $5,600,000 | |
| Closed | Villarreal Maria R | $151,000 | |
| Previous Owner | Villarreal Maria R | $180,000 | |
| Previous Owner | Villarreal Maria R | $230,000 | |
| Previous Owner | Villarreal Maria R | $220,000 | |
| Previous Owner | Villareal Maria R | $85,250 | |
| Previous Owner | Villarreal Maria R | $116,300 |
Source: Public Records
Tax History Compared to Growth
Tax History
| Year | Tax Paid | Tax Assessment Tax Assessment Total Assessment is a certain percentage of the fair market value that is determined by local assessors to be the total taxable value of land and additions on the property. | Land | Improvement |
|---|---|---|---|---|
| 2023 | $4,530 | $234,903 | $82,035 | $152,868 |
| 2022 | $4,446 | $230,298 | $80,427 | $149,871 |
| 2021 | $4,270 | $225,783 | $78,850 | $146,933 |
| 2020 | $4,182 | $223,469 | $78,042 | $145,427 |
| 2019 | $4,054 | $219,088 | $76,512 | $142,576 |
| 2018 | $3,985 | $214,793 | $75,012 | $139,781 |
| 2017 | $3,975 | $210,583 | $73,542 | $137,041 |
| 2016 | $3,756 | $206,454 | $72,100 | $134,354 |
| 2015 | $3,737 | $203,353 | $71,017 | $132,336 |
| 2014 | $3,279 | $199,370 | $69,626 | $129,744 |
Source: Public Records
Map
Nearby Homes
- 126 Colonade Square
- 2925 Florence Ave Unit 12
- 2925 Florence Ave Unit 17
- 34 S Capitol Ave
- 2604 Sierra Vista Ct
- 10488 Layton Way
- 373 Doris Ave
- 145 Sierra Vista Place
- 10350 Doris Ave
- 114 Monte Verano Ct
- 37 Monte Verano Ct
- 178 Monte Verano Ct
- 147 Cedar Ln
- 00 Muirfield Dr
- 0 Muirfield Dr Unit ML81985851
- 166 Millar Ave
- 14080 Jerilyn Dr
- 2396 Summer St
- 210 Gramercy Place
- 3399 E Hills Dr