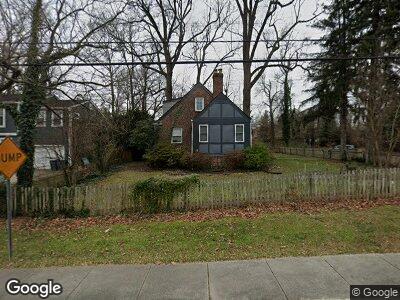
10308 Edgewood Ave Silver Spring, MD 20901
Northwood NeighborhoodEstimated Value: $662,000 - $746,000
4
Beds
2
Baths
1,485
Sq Ft
$471/Sq Ft
Est. Value
About This Home
This home is located at 10308 Edgewood Ave, Silver Spring, MD 20901 and is currently estimated at $699,079, approximately $470 per square foot. 10308 Edgewood Ave is a home located in Montgomery County with nearby schools including Montgomery Knolls Elementary School, Pine Crest Elementary School, and Silver Spring International Middle School.
Ownership History
Date
Name
Owned For
Owner Type
Purchase Details
Closed on
Jun 14, 2021
Sold by
Kettenring Brian W and Lawson Jennifer D
Bought by
Rinzler Ari Anne and Ballantyne Amanda
Current Estimated Value
Home Financials for this Owner
Home Financials are based on the most recent Mortgage that was taken out on this home.
Original Mortgage
$548,250
Outstanding Balance
$507,054
Interest Rate
2.9%
Mortgage Type
New Conventional
Estimated Equity
$174,997
Purchase Details
Closed on
May 17, 2011
Sold by
Hussey Laura L
Bought by
Lawson Jennifer D and Kettenring Brian W
Purchase Details
Closed on
Apr 25, 2011
Sold by
Hussey Laura L and Rotenstein David S
Bought by
Lawson Jennifer D and Kettenring Brian W
Purchase Details
Closed on
Dec 13, 2002
Sold by
Monti Twyla
Bought by
Hussey Laura L and Rotenstein David S
Purchase Details
Closed on
Oct 22, 1996
Sold by
M Patrick M and M Monti P
Bought by
Monti Twyla
Create a Home Valuation Report for This Property
The Home Valuation Report is an in-depth analysis detailing your home's value as well as a comparison with similar homes in the area
Home Values in the Area
Average Home Value in this Area
Purchase History
| Date | Buyer | Sale Price | Title Company |
|---|---|---|---|
| Rinzler Ari Anne | $625,000 | Paragon Title & Escrow Co | |
| Lawson Jennifer D | $422,000 | -- | |
| Lawson Jennifer D | $422,000 | None Available | |
| Lawson Jennifer D | $422,000 | -- | |
| Hussey Laura L | $325,000 | -- | |
| Monti Twyla | $157,000 | -- |
Source: Public Records
Mortgage History
| Date | Status | Borrower | Loan Amount |
|---|---|---|---|
| Open | Rinzler Ari Anne | $548,250 | |
| Previous Owner | Kettenring Brian W | $25,000 | |
| Previous Owner | Lawson Jennifer D | $328,000 |
Source: Public Records
Tax History Compared to Growth
Tax History
| Year | Tax Paid | Tax Assessment Tax Assessment Total Assessment is a certain percentage of the fair market value that is determined by local assessors to be the total taxable value of land and additions on the property. | Land | Improvement |
|---|---|---|---|---|
| 2024 | $5,895 | $448,600 | $0 | $0 |
| 2023 | $4,834 | $418,600 | $0 | $0 |
| 2022 | $4,250 | $388,600 | $225,600 | $163,000 |
| 2021 | $4,071 | $378,300 | $0 | $0 |
| 2020 | $3,922 | $368,000 | $0 | $0 |
| 2019 | $3,773 | $357,700 | $225,600 | $132,100 |
| 2018 | $3,749 | $357,700 | $225,600 | $132,100 |
| 2017 | $4,011 | $357,700 | $0 | $0 |
| 2016 | $3,974 | $368,200 | $0 | $0 |
| 2015 | $3,974 | $368,200 | $0 | $0 |
| 2014 | $3,974 | $368,200 | $0 | $0 |
Source: Public Records
Map
Nearby Homes
- 123 Northwood Ave
- 306 Marvin Rd
- 10210 Pierce Dr
- 10700 Cavalier Dr
- 10126 Renfrew Rd
- 10004 Kinross Ave
- 10028 Greenock Rd
- 10816 Lombardy Rd
- 9906 Rogart Rd
- 123 Eastmoor Dr
- 903 Laredo Rd
- 9901 Markham St
- 1109 Chiswell Ln
- 1106 Dryden St
- 1002 Laredo Rd
- 209 Saint Lawrence Dr
- 229 Hannes St
- 227 Hannes St
- 1104 Caddington Ave
- 827 University Blvd W