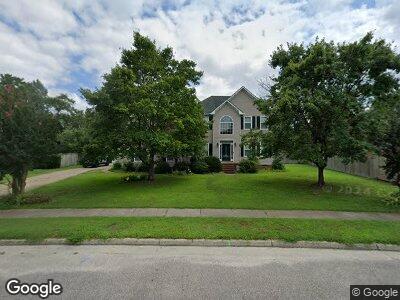
1033 Artisan Ave Chesapeake, VA 23323
Deep Creek-Portsmouth NeighborhoodEstimated Value: $632,000 - $700,000
5
Beds
3
Baths
3,100
Sq Ft
$216/Sq Ft
Est. Value
About This Home
This home is located at 1033 Artisan Ave, Chesapeake, VA 23323 and is currently estimated at $668,428, approximately $215 per square foot. 1033 Artisan Ave is a home located in Chesapeake City with nearby schools including Grassfield Elementary School, Hugo a Owens Middle, and Grassfield High School.
Ownership History
Date
Name
Owned For
Owner Type
Purchase Details
Closed on
Dec 1, 2021
Sold by
Brown Joel Anthony and Brown Connie Sue
Bought by
Anderson Brian and Anderson Diane
Current Estimated Value
Home Financials for this Owner
Home Financials are based on the most recent Mortgage that was taken out on this home.
Original Mortgage
$543,827
Outstanding Balance
$505,163
Interest Rate
3.09%
Mortgage Type
VA
Estimated Equity
$163,265
Purchase Details
Closed on
May 13, 2003
Sold by
Baker Donald
Bought by
Brown Joel
Home Financials for this Owner
Home Financials are based on the most recent Mortgage that was taken out on this home.
Original Mortgage
$281,200
Interest Rate
5.93%
Mortgage Type
New Conventional
Purchase Details
Closed on
Nov 21, 2000
Sold by
Beco Construction Inc
Bought by
Baker Donald R
Home Financials for this Owner
Home Financials are based on the most recent Mortgage that was taken out on this home.
Original Mortgage
$115,500
Interest Rate
7.76%
Create a Home Valuation Report for This Property
The Home Valuation Report is an in-depth analysis detailing your home's value as well as a comparison with similar homes in the area
Home Values in the Area
Average Home Value in this Area
Purchase History
| Date | Buyer | Sale Price | Title Company |
|---|---|---|---|
| Anderson Brian | $580,000 | Attorney | |
| Brown Joel | $296,000 | -- | |
| Baker Donald R | $210,500 | -- |
Source: Public Records
Mortgage History
| Date | Status | Borrower | Loan Amount |
|---|---|---|---|
| Open | Anderson Brian | $543,827 | |
| Previous Owner | Brown Connie Sue | $19,400 | |
| Previous Owner | Brown Connie S | $384,657 | |
| Previous Owner | Brown Connie S | $396,825 | |
| Previous Owner | Brown Joel A | $120,000 | |
| Previous Owner | Brown Joel | $281,200 | |
| Previous Owner | Baker Donald R | $115,500 |
Source: Public Records
Tax History Compared to Growth
Tax History
| Year | Tax Paid | Tax Assessment Tax Assessment Total Assessment is a certain percentage of the fair market value that is determined by local assessors to be the total taxable value of land and additions on the property. | Land | Improvement |
|---|---|---|---|---|
| 2024 | $6,959 | $689,000 | $180,000 | $509,000 |
| 2023 | $5,968 | $694,000 | $150,000 | $544,000 |
| 2022 | $6,008 | $594,900 | $140,000 | $454,900 |
| 2021 | $4,846 | $461,500 | $120,000 | $341,500 |
| 2020 | $4,622 | $440,200 | $115,000 | $325,200 |
| 2019 | $4,622 | $440,200 | $115,000 | $325,200 |
| 2018 | $4,273 | $407,000 | $115,000 | $292,000 |
| 2017 | $3,985 | $379,500 | $105,000 | $274,500 |
| 2016 | $3,985 | $379,500 | $105,000 | $274,500 |
| 2015 | $3,936 | $374,900 | $105,000 | $269,900 |
| 2014 | $3,887 | $370,200 | $105,000 | $265,200 |
Source: Public Records
Map
Nearby Homes
- 2210 Chesterfield Loop
- 2121 Chesterfield Loop
- 1057 West Rd
- 2064 Cedar Rd
- 2409 Cedar Rd
- 501 Cassway Arch
- 2417 Cedar Rd
- 1751 Emerald Sea Dr
- 2500 Garth Way
- 714 Creekwood Dr
- 300 Sluice Ct
- 940 Baneberry St
- 804 Majestic Ct
- 2141 Sunset Maple Ln
- 940 Baneberry Way
- 2361 Number Ten Ln
- 2138 Tall Pine Dr
- 3017 Patrick Henry Dr
- 2413 Spellbound Point
- 521 Atamasco St