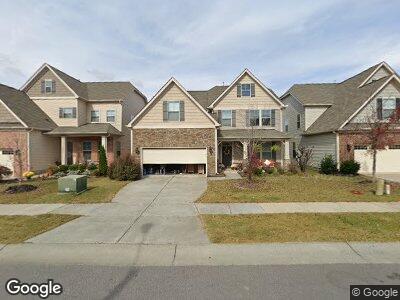
1033 Laredo Ln Durham, NC 27703
Eastern Durham NeighborhoodEstimated Value: $520,000 - $530,000
4
Beds
3
Baths
2,383
Sq Ft
$220/Sq Ft
Est. Value
About This Home
This home is located at 1033 Laredo Ln, Durham, NC 27703 and is currently estimated at $525,190, approximately $220 per square foot. 1033 Laredo Ln is a home located in Durham County with nearby schools including Spring Valley Elementary School, John W Neal Middle School, and Southern School of Energy & Sustainability.
Ownership History
Date
Name
Owned For
Owner Type
Purchase Details
Closed on
Mar 6, 2018
Sold by
Linder Dean F and Linder Aimee
Bought by
Miller Joshua Ryan
Current Estimated Value
Home Financials for this Owner
Home Financials are based on the most recent Mortgage that was taken out on this home.
Original Mortgage
$279,000
Interest Rate
4.04%
Mortgage Type
New Conventional
Purchase Details
Closed on
Mar 9, 2016
Sold by
Level Carolina Homes Llc
Bought by
Bingham Michael A and Cox Shana Amanda
Purchase Details
Closed on
Dec 21, 2015
Sold by
Level Carolina Homes Llc
Bought by
Linder Dean F and Linder Aimee
Home Financials for this Owner
Home Financials are based on the most recent Mortgage that was taken out on this home.
Original Mortgage
$262,700
Interest Rate
3.91%
Mortgage Type
New Conventional
Purchase Details
Closed on
Aug 31, 2015
Sold by
Mrce Level Brightleaf Spring Groves Llc
Bought by
Level Carolina Homes Llc
Create a Home Valuation Report for This Property
The Home Valuation Report is an in-depth analysis detailing your home's value as well as a comparison with similar homes in the area
Home Values in the Area
Average Home Value in this Area
Purchase History
| Date | Buyer | Sale Price | Title Company |
|---|---|---|---|
| Miller Joshua Ryan | $310,000 | None Available | |
| Bingham Michael A | $305,000 | -- | |
| Linder Dean F | $277,000 | Attorney | |
| Level Carolina Homes Llc | $573,500 | Attorney |
Source: Public Records
Mortgage History
| Date | Status | Borrower | Loan Amount |
|---|---|---|---|
| Open | Miller Josh Ryan | $130,000 | |
| Open | Miller Joshua Ray | $277,142 | |
| Closed | Miller Joshua Ryan | $279,000 | |
| Previous Owner | Linder Dean F | $262,700 |
Source: Public Records
Tax History Compared to Growth
Tax History
| Year | Tax Paid | Tax Assessment Tax Assessment Total Assessment is a certain percentage of the fair market value that is determined by local assessors to be the total taxable value of land and additions on the property. | Land | Improvement |
|---|---|---|---|---|
| 2024 | $4,231 | $303,301 | $70,375 | $232,926 |
| 2023 | $3,973 | $303,301 | $70,375 | $232,926 |
| 2022 | $3,882 | $303,301 | $70,375 | $232,926 |
| 2021 | $3,864 | $303,301 | $70,375 | $232,926 |
| 2020 | $3,773 | $303,301 | $70,375 | $232,926 |
| 2019 | $3,773 | $303,301 | $70,375 | $232,926 |
| 2018 | $3,386 | $249,609 | $56,300 | $193,309 |
| 2017 | $758 | $56,300 | $56,300 | $0 |
| 2016 | $733 | $56,300 | $56,300 | $0 |
| 2015 | $733 | $52,948 | $52,948 | $0 |
Source: Public Records
Map
Nearby Homes
- 1040 Laredo Ln
- 2105 Woodsdale Dr
- 2815 Mebane Ln
- 2166 Pink Peony Cir Unit 162
- 1011 Red Roses Ave
- 2165 Pink Peony Cir Unit 230
- 1914 Woodsdale Dr
- 835 Poplar St
- 2310 Gilman St
- 205 Spring Flower Ln
- 1912 Pennypacker Ln
- 1913 Brodgen Ln
- 814 Ember Dr
- 622 Sherron Rd
- 610 Sherron Rd
- 3021 Crossman Lake Rd
- 10 Parker Pond Ct
- 1 Parker Pond Ct
- 120 Putters Ct
- 1301 Doc Nichols Rd