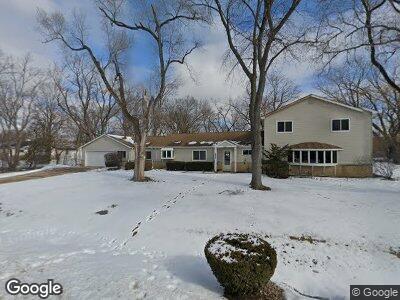
1035 N Bluebonnet Ln Hoffman Estates, IL 60169
Woodfield NeighborhoodEstimated Value: $531,962 - $688,000
4
Beds
3
Baths
3,582
Sq Ft
$170/Sq Ft
Est. Value
About This Home
This home is located at 1035 N Bluebonnet Ln, Hoffman Estates, IL 60169 and is currently estimated at $607,741, approximately $169 per square foot. 1035 N Bluebonnet Ln is a home located in Cook County with nearby schools including Fairview Elementary School, Helen Keller Junior High School, and J B Conant High School.
Ownership History
Date
Name
Owned For
Owner Type
Purchase Details
Closed on
Jan 28, 2025
Sold by
Engelhardt Shelly
Bought by
Shelly M Engelhardt 2025 Trust and Engelhardt
Current Estimated Value
Purchase Details
Closed on
Sep 27, 2013
Sold by
Engelhardt Shelly and Engelhardt Alan William
Bought by
Engelhardt Shelly
Home Financials for this Owner
Home Financials are based on the most recent Mortgage that was taken out on this home.
Original Mortgage
$232,000
Interest Rate
5%
Mortgage Type
New Conventional
Purchase Details
Closed on
Mar 11, 1994
Sold by
Engelhardt Alan and Engelhardt Shelly
Bought by
Engelhardt Alan and Engelhardt Shelly
Purchase Details
Closed on
Oct 9, 1993
Sold by
Gacek Eugene W and Gacek Marlene E
Bought by
Engelhardt Alan and Engelhardt Shelly
Create a Home Valuation Report for This Property
The Home Valuation Report is an in-depth analysis detailing your home's value as well as a comparison with similar homes in the area
Home Values in the Area
Average Home Value in this Area
Purchase History
| Date | Buyer | Sale Price | Title Company |
|---|---|---|---|
| Shelly M Engelhardt 2025 Trust | -- | None Listed On Document | |
| Engelhardt Alan | -- | -- | |
| Engelhardt Alan | -- | -- |
Source: Public Records
Mortgage History
| Date | Status | Borrower | Loan Amount |
|---|---|---|---|
| Previous Owner | Engelhardt Shelly | $232,000 | |
| Previous Owner | Engelhardt Alan | $150,000 | |
| Previous Owner | Engelhardt Alan | $220,000 | |
| Previous Owner | Engelhardt Alan | $161,500 |
Source: Public Records
Tax History Compared to Growth
Tax History
| Year | Tax Paid | Tax Assessment Tax Assessment Total Assessment is a certain percentage of the fair market value that is determined by local assessors to be the total taxable value of land and additions on the property. | Land | Improvement |
|---|---|---|---|---|
| 2024 | $12,348 | $45,000 | $10,769 | $34,231 |
| 2023 | $12,348 | $45,000 | $10,769 | $34,231 |
| 2022 | $12,348 | $45,000 | $10,769 | $34,231 |
| 2021 | $12,945 | $41,968 | $11,441 | $30,527 |
| 2020 | $12,717 | $41,968 | $11,441 | $30,527 |
| 2019 | $12,802 | $47,156 | $11,441 | $35,715 |
| 2018 | $11,038 | $37,285 | $10,095 | $27,190 |
| 2017 | $10,860 | $37,285 | $10,095 | $27,190 |
| 2016 | $10,364 | $37,285 | $10,095 | $27,190 |
| 2015 | $8,787 | $29,983 | $8,749 | $21,234 |
| 2014 | $8,650 | $29,983 | $8,749 | $21,234 |
| 2013 | $8,410 | $29,983 | $8,749 | $21,234 |
Source: Public Records
Map
Nearby Homes
- 410 Aster Ln
- 185 Carthage Ln
- 315 Apache Ln
- 903 Sturnbridge Ct
- 617 Manomet Ct
- 10 Flagstaff Ln
- 763 Whalom Ln Unit 2A1
- 775 Whalom Ln Unit 1A2
- 5 Kingman Ln
- 359 Juniper Tree Ct Unit 3
- 604 Bayview Point Unit 41E
- 75 Kristin Dr Unit 104
- 10 W Thacker St
- 109 White Oak Ct Unit 10
- 621 Breakers Point Unit 31D
- 623 Breakers Point Unit 31F
- 602 Fairbanks Ct Unit Z1
- 416 Oakmont Ln
- 735 Shoreline Cir Unit 83B
- 960 Olive St