10351 Avenue 112 Pixley, CA 93256
Estimated payment $11,988/month
Highlights
- 77.68 Acre Lot
- No HOA
- Agricultural
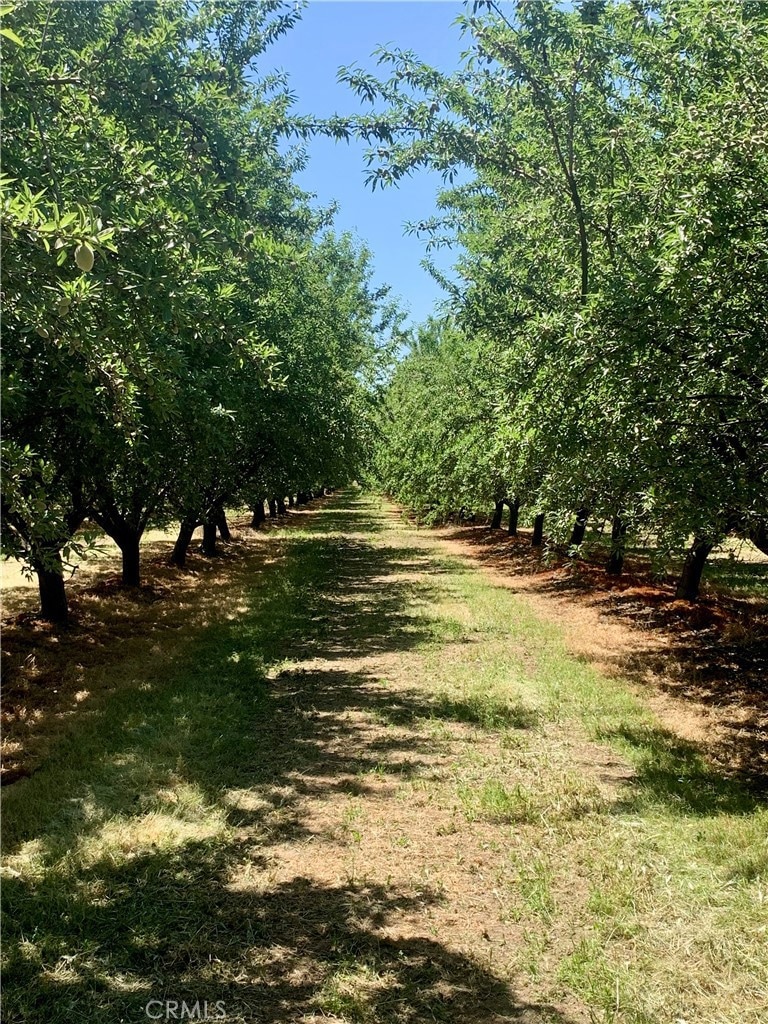
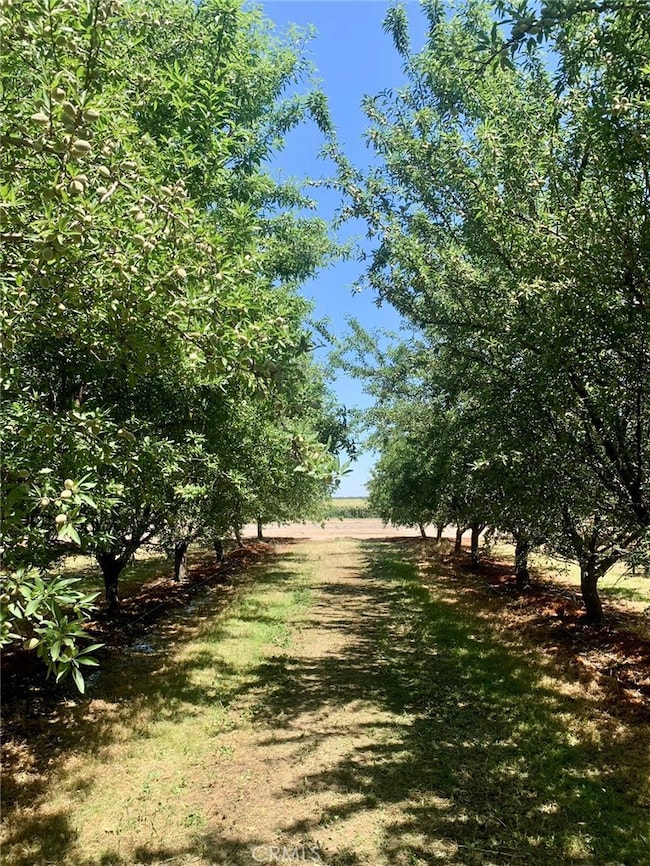
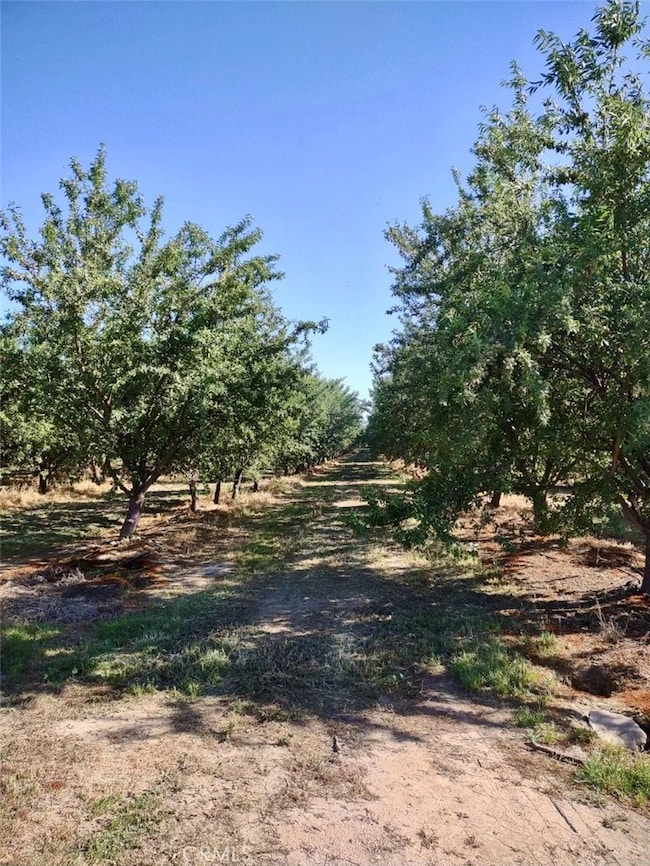
- Orchard Views
About This Lot
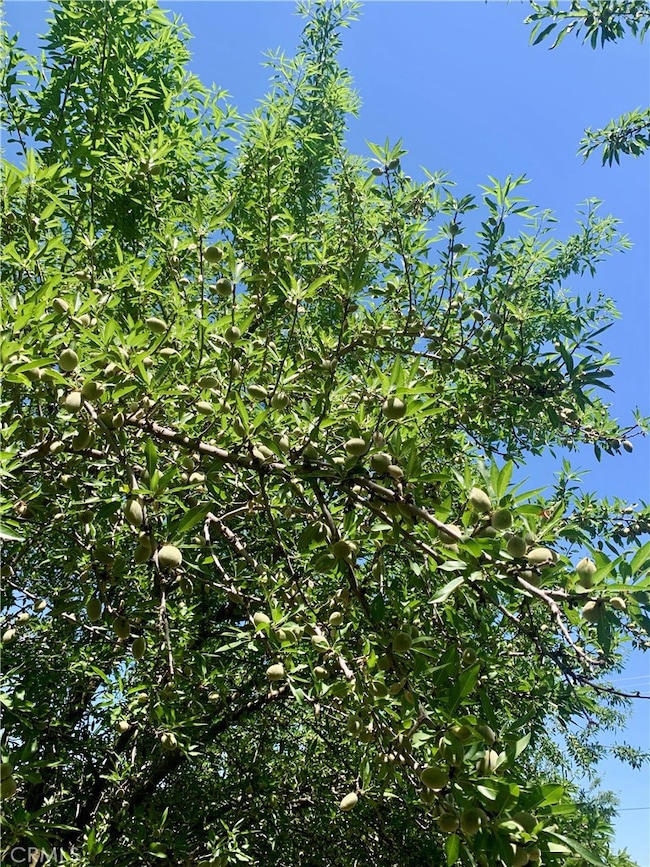
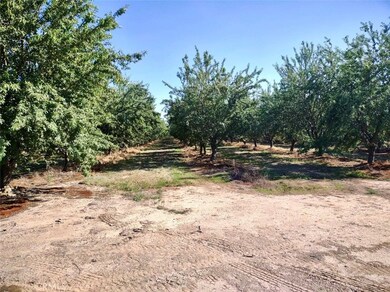
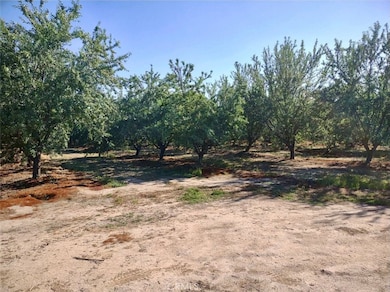
77.68Acres Almond Orchard.
Listing Agent
Harvest Realty Development Brokerage Phone: 626-720-7998 License #01975843

Co-Listing Agent
Harvest Realty Development Brokerage Phone: 626-720-7998 License #02035269
Property Details
Property Type
- Land
Est. Annual Taxes
- $10,219
Year Built
- 1900
Lot Details
- 77.68 Acre Lot
- Property is zoned AE-40
Additional Features
- Orchard Views
- Suburban Location
- Agricultural
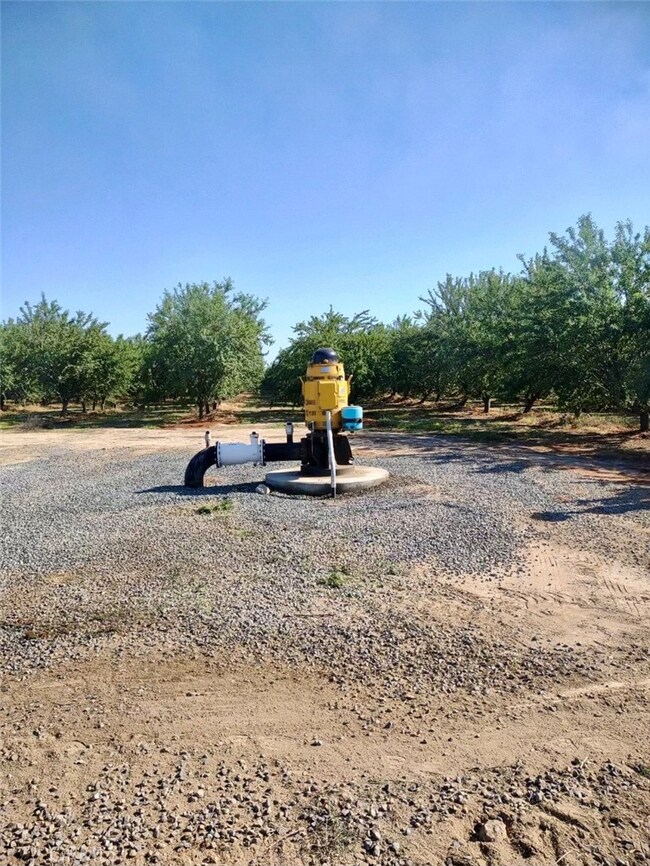
- Agricultural Well Water Source
Community Details
- No Home Owners Association
Listing and Financial Details
- Assessor Parcel Number 293140003000
- $10,746 per year additional tax assessments
Map
Home Values in the Area
Average Home Value in this Area
Tax History
| Year | Tax Paid | Tax Assessment Tax Assessment Total Assessment is a certain percentage of the fair market value that is determined by local assessors to be the total taxable value of land and additions on the property. | Land | Improvement |
|---|---|---|---|---|
| 2024 | $10,219 | $751,019 | $197,180 | $553,839 |
| 2023 | $10,746 | $812,191 | $176,237 | $635,954 |
| 2022 | $11,620 | $930,306 | $172,198 | $758,108 |
| 2021 | $4,961 | $306,581 | $159,416 | $147,165 |
| 2020 | $4,989 | $300,889 | $155,233 | $145,656 |
| 2019 | $5,069 | $294,531 | $151,731 | $142,800 |
| 2018 | $2,708 | $209,895 | $129,346 | $80,549 |
| 2017 | $4,994 | $388,374 | $161,231 | $227,143 |
| 2016 | $4,803 | $380,758 | $158,070 | $222,688 |
| 2015 | $5,088 | $375,038 | $155,695 | $219,343 |
| 2014 | $5,088 | $414,882 | $152,645 | $262,237 |
Property History
| Date | Event | Price | Change | Sq Ft Price |
|---|---|---|---|---|
| 01/01/2025 01/01/25 | Price Changed | $1,999,000 | -0.1% | -- |
| 04/28/2024 04/28/24 | For Sale | $2,000,000 | -- | -- |
Deed History
| Date | Type | Sale Price | Title Company |
|---|---|---|---|
| Grant Deed | $2,512,000 | Chicago Tilte | |
| Grant Deed | $2,255,000 | Chicago Title | |
| Interfamily Deed Transfer | -- | None Available | |
| Interfamily Deed Transfer | -- | Chicago Title Co | |
| Grant Deed | -- | Chicago Title Co | |
| Grant Deed | $165,000 | Chicago Title Co |
Mortgage History
| Date | Status | Loan Amount | Loan Type |
|---|---|---|---|
| Previous Owner | $5,000,000 | Unknown | |
| Previous Owner | $1,500,300 | Unknown | |
| Previous Owner | $128,750 | Seller Take Back |
Source: California Regional Multiple Listing Service (CRMLS)
MLS Number: TR24084254
APN: 293-140-003-000
Disclaimer: Certain information contained herein is derived from information provided by parties other than Homes.com. All information provided is deemed reliable, but is not guaranteed to be accurate and should be independently verified.
![]() The multiple listing data appearing on this website, or contained in reports produced therefrom, is owned and copyrighted by California Regional Multiple Listing Service, Inc. ("CRMLS") and is protected by all applicable copyright laws. Information provided is for viewer's personal, non-commercial use and may not be used for any purpose other than to identify prospective properties the viewer may be interested in purchasing. All listing data, including but not limited to square footage and lot size is believed to be accurate, but the listing Agent, listing Broker and CRMLS and its affiliates do not warrant or guarantee such accuracy. The viewer should independently verify the listed data prior to making any decisions based on such information by personal inspection and/or contacting a real estate professional.
The multiple listing data appearing on this website, or contained in reports produced therefrom, is owned and copyrighted by California Regional Multiple Listing Service, Inc. ("CRMLS") and is protected by all applicable copyright laws. Information provided is for viewer's personal, non-commercial use and may not be used for any purpose other than to identify prospective properties the viewer may be interested in purchasing. All listing data, including but not limited to square footage and lot size is believed to be accurate, but the listing Agent, listing Broker and CRMLS and its affiliates do not warrant or guarantee such accuracy. The viewer should independently verify the listed data prior to making any decisions based on such information by personal inspection and/or contacting a real estate professional.
Based on information from California Regional Multiple Listing Service, Inc. and /or other sources. All data, including all measurements and calculations of area, is obtained from various sources and has not been, and will not be, verified by broker or MLS. All information should be independently reviewed and verified for accuracy. Properties may or may not be listed by the office/agent presenting the information
- 821 E Stanford Ave
- 701 E Stanford Ave
- 99999 N Elm St
- 3184 Road 122
- 2133 N Cedar St
- 9999 N Elm St
- 1430 N Park Dr
- 0 N Palm St
- 12250 Avenue 120
- 542 E Howard Ave
- 0 120 Ave Unit 232659
- 11601 Road 120
- 336 S Elm St
- 194 S Pine St
- 991 E Davis St
- 1120 E Joanne Ave
- 837 S Elm St
- 1071 S Elm St
- 1875 S Elm St
- 3063 E Sierra Ave