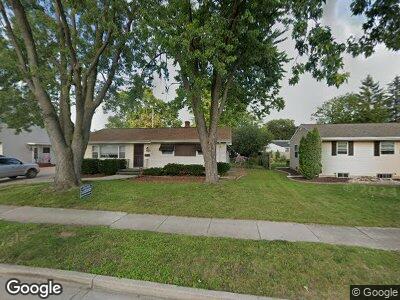
1036 Campbell St Neenah, WI 54956
Estimated Value: $313,000 - $361,000
--
Bed
2
Baths
1,604
Sq Ft
$213/Sq Ft
Est. Value
About This Home
This home is located at 1036 Campbell St, Neenah, WI 54956 and is currently estimated at $341,591, approximately $212 per square foot. 1036 Campbell St is a home located in Winnebago County with nearby schools including Horace Mann Middle School, Coolidge Elementary School, and Shattuck Middle School.
Ownership History
Date
Name
Owned For
Owner Type
Purchase Details
Closed on
Jan 6, 2022
Sold by
Rehorst Linda L and Rehorst Joseph
Bought by
Rose Jose J and Rose Nancy L
Current Estimated Value
Home Financials for this Owner
Home Financials are based on the most recent Mortgage that was taken out on this home.
Original Mortgage
$195,000
Outstanding Balance
$182,872
Interest Rate
3.05%
Mortgage Type
New Conventional
Estimated Equity
$170,422
Purchase Details
Closed on
Dec 2, 2021
Sold by
Linda L Rose Revocable Trust and Rehorst Linda L
Bought by
Rehorst Linda L
Home Financials for this Owner
Home Financials are based on the most recent Mortgage that was taken out on this home.
Original Mortgage
$195,000
Outstanding Balance
$182,872
Interest Rate
3.05%
Mortgage Type
New Conventional
Estimated Equity
$170,422
Purchase Details
Closed on
Oct 17, 2014
Sold by
Rose Linda L
Bought by
Rose Linda L
Create a Home Valuation Report for This Property
The Home Valuation Report is an in-depth analysis detailing your home's value as well as a comparison with similar homes in the area
Home Values in the Area
Average Home Value in this Area
Purchase History
| Date | Buyer | Sale Price | Title Company |
|---|---|---|---|
| Rose Jose J | $176,000 | None Listed On Document | |
| Rehorst Linda L | -- | -- | |
| Rose Linda L | -- | -- |
Source: Public Records
Mortgage History
| Date | Status | Borrower | Loan Amount |
|---|---|---|---|
| Open | Rose Jose J | $50,000 | |
| Open | Rose Jose J | $195,000 | |
| Closed | Rehorst Linda L | -- |
Source: Public Records
Tax History Compared to Growth
Tax History
| Year | Tax Paid | Tax Assessment Tax Assessment Total Assessment is a certain percentage of the fair market value that is determined by local assessors to be the total taxable value of land and additions on the property. | Land | Improvement |
|---|---|---|---|---|
| 2023 | $5,632 | $308,500 | $32,500 | $276,000 |
| 2022 | $5,196 | $241,800 | $30,000 | $211,800 |
| 2021 | $5,146 | $241,800 | $30,000 | $211,800 |
| 2020 | $5,222 | $241,800 | $30,000 | $211,800 |
| 2019 | $4,903 | $241,800 | $30,000 | $211,800 |
| 2018 | $4,271 | $189,100 | $28,800 | $160,300 |
| 2017 | $4,251 | $189,100 | $28,800 | $160,300 |
| 2016 | $4,228 | $189,100 | $28,800 | $160,300 |
| 2015 | $4,257 | $189,100 | $28,800 | $160,300 |
| 2014 | $4,300 | $189,100 | $28,800 | $160,300 |
| 2013 | $4,511 | $189,100 | $28,800 | $160,300 |
Source: Public Records
Map
Nearby Homes
- 974 Grove St
- 509 E Peckham St
- 866 Maple St
- 421 Hawthorne St
- 2013 Henry St
- 452 Lowell Place
- 745 Manchester Rd
- 1571 Bruce St
- 525 Elm St
- 773 Amber Ln
- 916 Bayview Rd
- 640 Higgins Ave
- 233 Stevens St
- 322 W Bell St
- 808 Henry St
- 1513 Hidden Acres Ln
- 0 Limekiln Dr
- 968 Bridgewood Dr
- 415 Union St
- 127 Southfield Ct