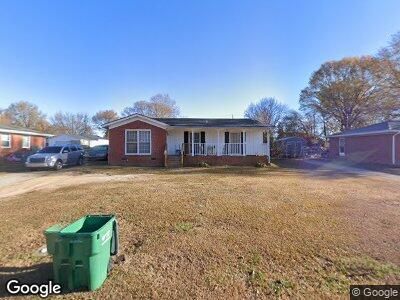
104 Peachwood St Moore, SC 29369
Moore NeighborhoodEstimated Value: $107,000 - $169,000
3
Beds
1
Bath
1,322
Sq Ft
$110/Sq Ft
Est. Value
About This Home
This home is located at 104 Peachwood St, Moore, SC 29369 and is currently estimated at $145,491, approximately $110 per square foot. 104 Peachwood St is a home located in Spartanburg County with nearby schools including Dorman High School Freshman Campus, Dorman High School, and Fine Arts Preparatory School.
Ownership History
Date
Name
Owned For
Owner Type
Purchase Details
Closed on
Apr 7, 2020
Sold by
Pkk Holdings Llc
Bought by
Sca 1 Llc
Current Estimated Value
Purchase Details
Closed on
Dec 14, 2016
Sold by
Beth Page Investmetns Llc
Bought by
Pkk Holdigs Llc
Purchase Details
Closed on
Aug 6, 2008
Sold by
Graham Terence D
Bought by
Bethpage Investments Llc
Purchase Details
Closed on
Dec 29, 2006
Sold by
Canzater Liberty A
Bought by
Graham Terence D
Home Financials for this Owner
Home Financials are based on the most recent Mortgage that was taken out on this home.
Original Mortgage
$69,275
Interest Rate
8.95%
Mortgage Type
Purchase Money Mortgage
Purchase Details
Closed on
Jun 24, 2004
Sold by
Bank One Na
Bought by
Canzater Liberty A
Purchase Details
Closed on
Apr 21, 2004
Sold by
Smith Theresa P and Morse Alice Smith
Bought by
Bank One Na
Create a Home Valuation Report for This Property
The Home Valuation Report is an in-depth analysis detailing your home's value as well as a comparison with similar homes in the area
Home Values in the Area
Average Home Value in this Area
Purchase History
| Date | Buyer | Sale Price | Title Company |
|---|---|---|---|
| Sca 1 Llc | $110,000 | None Available | |
| Pkk Holdigs Llc | $99,000 | None Available | |
| Bethpage Investments Llc | $55,251 | -- | |
| Graham Terence D | $81,500 | None Available | |
| Canzater Liberty A | $38,000 | -- | |
| Bank One Na | $2,500 | -- |
Source: Public Records
Mortgage History
| Date | Status | Borrower | Loan Amount |
|---|---|---|---|
| Previous Owner | Sca I Llc | $897,500 | |
| Previous Owner | Graham Terence D | $69,275 |
Source: Public Records
Tax History Compared to Growth
Tax History
| Year | Tax Paid | Tax Assessment Tax Assessment Total Assessment is a certain percentage of the fair market value that is determined by local assessors to be the total taxable value of land and additions on the property. | Land | Improvement |
|---|---|---|---|---|
| 2024 | $1,512 | $4,023 | $534 | $3,489 |
| 2023 | $1,512 | $4,023 | $534 | $3,489 |
| 2022 | $1,382 | $3,498 | $468 | $3,030 |
| 2021 | $1,368 | $3,498 | $468 | $3,030 |
| 2020 | $1,354 | $3,498 | $468 | $3,030 |
| 2019 | $1,337 | $3,498 | $468 | $3,030 |
| 2018 | $1,337 | $3,498 | $468 | $3,030 |
| 2017 | $1,839 | $4,974 | $510 | $4,464 |
| 2016 | $1,843 | $4,974 | $510 | $4,464 |
| 2015 | $1,807 | $4,974 | $510 | $4,464 |
| 2014 | $1,764 | $4,974 | $510 | $4,464 |
Source: Public Records
Map
Nearby Homes
- 406 Old Farm Rd
- 118 Rodney St
- 402 & 404 Sierra Rd
- 402 & 404 Sierra Dr
- 324 Prosperity Ln
- 232 Upper Beaver Creek Dr
- 332 Prosperity Ln
- 329 Prosperity Ln
- 271 Upper Beaver Creek Dr
- 275 Upper Beaver Creek Dr
- 336 Prosperity Ln
- 337 Prosperity Ln
- 344 Prosperity Ln
- 341 Prosperity Ln
- 348 Prosperity Ln
- 345 Prosperity Ln
- 349 Prosperity Ln
- 201 Old Salem Rd
- 188 Braxton Dr
- 2173 Davenport Ct