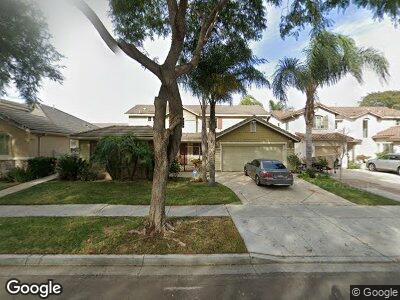
1041 Cesar Chavez Dr Oxnard, CA 93030
West Village NeighborhoodEstimated Value: $956,000 - $988,000
4
Beds
3
Baths
2,812
Sq Ft
$345/Sq Ft
Est. Value
About This Home
This home is located at 1041 Cesar Chavez Dr, Oxnard, CA 93030 and is currently estimated at $969,088, approximately $344 per square foot. 1041 Cesar Chavez Dr is a home located in Ventura County with nearby schools including Brekke Elementary School, R.J. Frank Academy of Marine Science & Engineering, and Pacifica High School.
Ownership History
Date
Name
Owned For
Owner Type
Purchase Details
Closed on
Oct 10, 2008
Sold by
Wells Fargo Bank Na
Bought by
Hurtado Leopoldo Gutierrez and Gutierrez Myrna Ramona
Current Estimated Value
Home Financials for this Owner
Home Financials are based on the most recent Mortgage that was taken out on this home.
Original Mortgage
$375,000
Interest Rate
6.09%
Mortgage Type
Purchase Money Mortgage
Purchase Details
Closed on
Aug 6, 2008
Sold by
Silva Manuel A and Silva Elydia Alamilo
Bought by
Wells Fargo Bank Na
Purchase Details
Closed on
May 10, 2005
Sold by
Wl Homes Llc
Bought by
Silva Manuel A and Alamillo Silva Elydia
Home Financials for this Owner
Home Financials are based on the most recent Mortgage that was taken out on this home.
Original Mortgage
$536,200
Interest Rate
1%
Mortgage Type
New Conventional
Create a Home Valuation Report for This Property
The Home Valuation Report is an in-depth analysis detailing your home's value as well as a comparison with similar homes in the area
Home Values in the Area
Average Home Value in this Area
Purchase History
| Date | Buyer | Sale Price | Title Company |
|---|---|---|---|
| Hurtado Leopoldo Gutierrez | $500,000 | California Title Company | |
| Wells Fargo Bank Na | $405,000 | Accommodation | |
| Silva Manuel A | $670,500 | Fidelity National Title Co |
Source: Public Records
Mortgage History
| Date | Status | Borrower | Loan Amount |
|---|---|---|---|
| Open | Hurtado Leopoldo Gutierrez | $46,188 | |
| Open | Hurtado Leopoldo Gutierrez | $365,000 | |
| Closed | Hurtado Leopoldo Gutierrez | $375,000 | |
| Previous Owner | Silva Manuel A | $600,000 | |
| Previous Owner | Silva Manuel A | $100,000 | |
| Previous Owner | Silva Manuel A | $65,000 | |
| Previous Owner | Silva Manuel A | $536,200 |
Source: Public Records
Tax History Compared to Growth
Tax History
| Year | Tax Paid | Tax Assessment Tax Assessment Total Assessment is a certain percentage of the fair market value that is determined by local assessors to be the total taxable value of land and additions on the property. | Land | Improvement |
|---|---|---|---|---|
| 2024 | $8,473 | $631,241 | $410,308 | $220,933 |
| 2023 | $7,577 | $618,864 | $402,263 | $216,601 |
| 2022 | $7,444 | $606,730 | $394,376 | $212,354 |
| 2021 | $7,725 | $594,834 | $386,643 | $208,191 |
| 2020 | $7,860 | $588,737 | $382,680 | $206,057 |
| 2019 | $7,544 | $577,194 | $375,177 | $202,017 |
| 2018 | $7,409 | $565,877 | $367,821 | $198,056 |
| 2017 | $6,949 | $554,782 | $360,609 | $194,173 |
| 2016 | $6,674 | $543,905 | $353,539 | $190,366 |
| 2015 | $7,095 | $535,737 | $348,230 | $187,507 |
| 2014 | $6,984 | $522,000 | $340,000 | $182,000 |
Source: Public Records
Map
Nearby Homes
- 1002 Resplandor Way
- 1423 Torero Dr
- 1611 Sonata Dr
- 1900 Almanor St
- 421 N Bonita Ave
- 2041 Indiana Dr
- 401 N Garfield Ave
- 447 Firenze St
- 2059 Veracruz Ln
- 116 N Harrison Ave
- 136 S Roosevelt Ave
- 1440 Morris St
- 238 Navarro St
- 1440 Crawford St
- 439 Deodar Ave
- 521 Galerita St
- 620 W Gonzales Rd Unit D
- 620 W Gonzales Rd Unit C
- 620 W Gonzales Rd Unit B
- 620 W Gonzales Rd Unit A