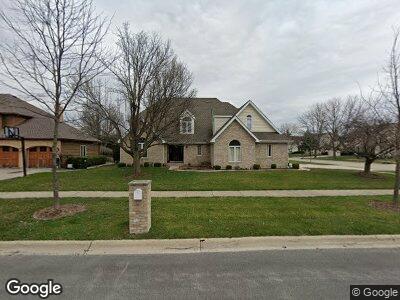
1045 Parkview Cir Carol Stream, IL 60188
Estimated Value: $528,000 - $653,000
4
Beds
4
Baths
3,162
Sq Ft
$191/Sq Ft
Est. Value
About This Home
This home is located at 1045 Parkview Cir, Carol Stream, IL 60188 and is currently estimated at $605,233, approximately $191 per square foot. 1045 Parkview Cir is a home located in DuPage County with nearby schools including Heritage Lakes Elementary School, Jay Stream Middle School, and Glenbard North High School.
Ownership History
Date
Name
Owned For
Owner Type
Purchase Details
Closed on
Jul 13, 2017
Sold by
Shan Mrunal and Shan Avani
Bought by
Motiwala Ahmed and Ar Rayyan Living Trust
Current Estimated Value
Purchase Details
Closed on
Aug 8, 1998
Sold by
Smedley David A and Smedley Peggy A
Bought by
Smedley David A and Smedley Peggy A
Purchase Details
Closed on
May 21, 1998
Sold by
Smedley David A and David A Smedley Trust
Bought by
Smedley David A and Smedley Peggy A
Home Financials for this Owner
Home Financials are based on the most recent Mortgage that was taken out on this home.
Original Mortgage
$179,000
Interest Rate
7.27%
Purchase Details
Closed on
May 13, 1997
Sold by
Smedley David A and Smedley Peggy A
Bought by
Smedley David A and Smedley Peggy A
Create a Home Valuation Report for This Property
The Home Valuation Report is an in-depth analysis detailing your home's value as well as a comparison with similar homes in the area
Home Values in the Area
Average Home Value in this Area
Purchase History
| Date | Buyer | Sale Price | Title Company |
|---|---|---|---|
| Motiwala Ahmed | $350,000 | Old Republic Title | |
| Smedley David A | -- | -- | |
| Smedley David A | -- | -- | |
| Smedley David A | -- | -- |
Source: Public Records
Mortgage History
| Date | Status | Borrower | Loan Amount |
|---|---|---|---|
| Previous Owner | Shah Mrunal | $304,000 | |
| Previous Owner | Smedley David A | $250,000 | |
| Previous Owner | Smedley David A | $200,000 | |
| Previous Owner | Smedley David A | $179,000 |
Source: Public Records
Tax History Compared to Growth
Tax History
| Year | Tax Paid | Tax Assessment Tax Assessment Total Assessment is a certain percentage of the fair market value that is determined by local assessors to be the total taxable value of land and additions on the property. | Land | Improvement |
|---|---|---|---|---|
| 2023 | $15,302 | $179,190 | $38,980 | $140,210 |
| 2022 | $14,813 | $166,540 | $36,230 | $130,310 |
| 2021 | $14,131 | $158,090 | $34,390 | $123,700 |
| 2020 | $13,835 | $153,350 | $33,360 | $119,990 |
| 2019 | $13,337 | $147,880 | $32,170 | $115,710 |
| 2018 | $10,262 | $116,670 | $30,780 | $85,890 |
| 2017 | $12,553 | $138,160 | $29,550 | $108,610 |
| 2016 | $12,336 | $131,970 | $28,230 | $103,740 |
| 2015 | $12,261 | $124,920 | $26,720 | $98,200 |
| 2014 | $13,253 | $132,380 | $26,040 | $106,340 |
| 2013 | $13,165 | $135,550 | $26,660 | $108,890 |
Source: Public Records
Map
Nearby Homes
- 1120 Mill Ct
- 1089 Baybrook Ln
- 1209 Easton Dr
- 1297 Country Glen Ln
- 942 Hill Crest Dr
- 1296 Lake Shore Dr
- 1314 Seabury Cir
- 1300 Gloucester Cir
- 1073 Ridgefield Cir
- 1184 Robin Dr
- 1351 Woodlake Dr
- 908 Hampton Dr
- 1312 Caribou Trail
- 918 Cumberland Ct
- 3945 Port Dr
- 2240 Greenbay Dr
- 1354 Georgetown Dr
- 1402 Walnut Cir Unit 6
- 641 Mayfair Dr
- 677 Larch Dr