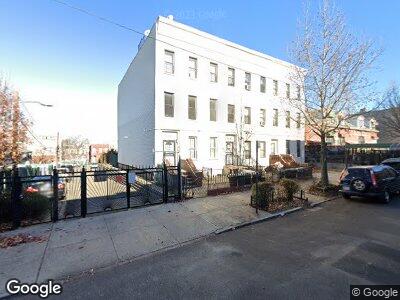
105 Hull St Brooklyn, NY 11233
Ocean Hill NeighborhoodEstimated Value: $1,041,000 - $1,413,000
10
Beds
5
Baths
2,310
Sq Ft
$511/Sq Ft
Est. Value
About This Home
This home is located at 105 Hull St, Brooklyn, NY 11233 and is currently estimated at $1,180,333, approximately $510 per square foot. 105 Hull St is a home located in Kings County with nearby schools including P.S. Is 155 Nicholas Herkimer, P.S./I.S. 137 Rachel Jean Mitchell, and P.S. 178 Saint Clair Mckelway.
Ownership History
Date
Name
Owned For
Owner Type
Purchase Details
Closed on
Jul 21, 2016
Sold by
Monroe 719 Llc
Bought by
105 Hull Group Llc
Current Estimated Value
Purchase Details
Closed on
Dec 30, 2015
Sold by
Fucito Sheriff Joseph
Bought by
Monroe 719 Llc
Purchase Details
Closed on
Jul 27, 2009
Sold by
Mcghee John L
Bought by
Mcghee John L and Mcghee John P
Purchase Details
Closed on
Feb 19, 1999
Sold by
Captiva Development Corp
Bought by
Mcghee John L
Purchase Details
Closed on
Dec 11, 1998
Sold by
Dream Home Connection Inc
Bought by
Captiva Development Corp
Purchase Details
Closed on
Jun 18, 1998
Sold by
Homestar Management Corp
Bought by
Dream Home Connection Inc
Home Financials for this Owner
Home Financials are based on the most recent Mortgage that was taken out on this home.
Original Mortgage
$126,000
Interest Rate
6.94%
Purchase Details
Closed on
May 26, 1998
Sold by
Warrick Doris
Bought by
Homestar Management Corp
Home Financials for this Owner
Home Financials are based on the most recent Mortgage that was taken out on this home.
Original Mortgage
$126,000
Interest Rate
6.94%
Create a Home Valuation Report for This Property
The Home Valuation Report is an in-depth analysis detailing your home's value as well as a comparison with similar homes in the area
Home Values in the Area
Average Home Value in this Area
Purchase History
| Date | Buyer | Sale Price | Title Company |
|---|---|---|---|
| 105 Hull Group Llc | -- | -- | |
| Monroe 719 Llc | $525,000 | -- | |
| Mcghee John L | -- | -- | |
| Mcghee John L | $65,000 | American Title Ins Co | |
| Captiva Development Corp | $132,000 | American Title Ins Co | |
| Dream Home Connection Inc | $140,000 | First American Title Ins Co | |
| Homestar Management Corp | $50,000 | First American Title Ins Co |
Source: Public Records
Mortgage History
| Date | Status | Borrower | Loan Amount |
|---|---|---|---|
| Open | 105 Hull Group Llc | $230,000 | |
| Open | 105 Hull Group Llc | $700,000 | |
| Previous Owner | Mcghee John | $406,250 | |
| Previous Owner | Dream Home Connection Inc | $126,000 |
Source: Public Records
Tax History Compared to Growth
Tax History
| Year | Tax Paid | Tax Assessment Tax Assessment Total Assessment is a certain percentage of the fair market value that is determined by local assessors to be the total taxable value of land and additions on the property. | Land | Improvement |
|---|---|---|---|---|
| 2024 | $3,358 | $70,500 | $19,200 | $51,300 |
| 2023 | $3,390 | $86,520 | $19,200 | $67,320 |
| 2022 | $3,147 | $70,800 | $19,200 | $51,600 |
| 2021 | $3,137 | $77,640 | $19,200 | $58,440 |
| 2020 | $1,545 | $75,660 | $19,200 | $56,460 |
| 2019 | $2,915 | $60,180 | $19,200 | $40,980 |
| 2018 | $2,836 | $13,912 | $5,456 | $8,456 |
| 2017 | $2,678 | $13,136 | $5,929 | $7,207 |
| 2016 | $2,483 | $12,420 | $6,805 | $5,615 |
| 2015 | $1,495 | $12,307 | $7,903 | $4,404 |
| 2014 | $1,495 | $11,611 | $8,944 | $2,667 |
Source: Public Records
Map
Nearby Homes
- 186 Macdougal St
- 205 Macdougal St Unit 3B
- 81 Hull St
- 2017 Fulton St
- 128 Thomas S Boyland St Unit 4
- 124 Thomas S Boyland St Unit 3
- 279 Sumpter St Unit 2B
- 246 Sumpter St Unit 2D
- 246 Sumpter St Unit 3-A
- 299 Sumpter St
- 267 Sumpter St
- 1241 Herkimer St
- 2148 Fulton St
- 210 Thomas S Boyand St
- 369 Marion St Unit 2nd Floor
- 10 Gunther Place
- 446 Chauncey St Unit 4464
- 446 Chauncey St Unit 4
- 25 Marconi Place
- 30 Gunther Place