NOT LISTED FOR SALE

105 Larkin Ct Hinesville, GA 31313

Estimated Value: $270,000 - $303,000

4 Beds
3 Baths
2,383 Sq Ft
$118/Sq Ft Est. Value

About This Home

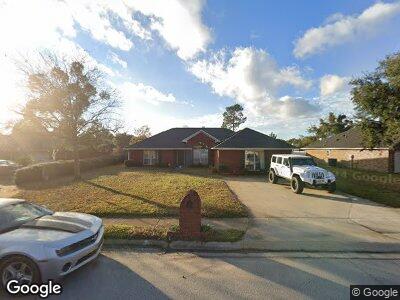
This home is located at 105 Larkin Ct, Hinesville, GA 31313 and is currently estimated at $281,220, approximately $118 per square foot. 105 Larkin Ct is a home located in Liberty County with nearby schools including Lyman Hall Elementary School, Lewis Frasier Middle School, and Bradwell Institute.

Ownership History

Date Name Owned For Owner Type

Purchase Details

Closed on
May 25, 2016
Sold by
Monroe James E
Bought by
Bruton Germany L and Bruton Janice L
Current Estimated Value
$281,220

Home Financials for this Owner

Home Financials are based on the most recent Mortgage that was taken out on this home.
Original Mortgage
$173,655
Outstanding Balance
$140,826
Interest Rate
3.66%
Mortgage Type
VA
Estimated Equity
$141,316

Purchase Details

Closed on
Jun 2, 2015
Sold by
The Bank Of New York Mello
Bought by
Monroe James

Home Financials for this Owner

Home Financials are based on the most recent Mortgage that was taken out on this home.
Original Mortgage
$84,000
Interest Rate
3.88%
Mortgage Type
New Conventional

Purchase Details

Closed on
Feb 3, 2015
Sold by
Finley Cassandra D
Bought by
The Bank Of New York Mellon Tr and Nationstar Home Equity Loan Tr Trust

Purchase Details

Closed on
Feb 25, 2003
Sold by
Dryden Ent Inc
Bought by
Finley Cassandra D

Purchase Details

Closed on
May 15, 2001
Bought by
Dryden Ent Inc

Range of Values:

Collateral Analytics

Collateral Analytics Collateral Analytics AVMs (Automated Valuation Model) employ a number of statistical approaches combined with neighborhood-specific comparable selection guarantees the most up-to-date and precise valuations.

Not Available

Collateral Analytics does not have data for the current month. Please view the chart for historical values.

ICE

ICE Mortgage Technology ICE Mortgage Technology’s AVM (Automated Valuation Model) is a state-of-the-art online residential property valuation tool that provides a quick and accurate estimate of the value of almost any home in the U.S.

Not Available

ICE Mortgage Technology does not have data for the current month. Please view the chart for historical values.

First American

First American First American Data & Analytics’ next-generation AVM combines unrivaled data assets with a blended ensemble of valuation models to produce highly accurate, reliable valuations you can trust.

Not Available

First American does not have data for the current month. Please view the chart for historical values.

Quantarium

Quantarium Quantarium’s valuation service, repeatedly proven the industry’s most accurate and comprehensive, is supercharged with a self-learning and auto-tuning AI engine that continually becomes smarter and more accurate as it processes daily inputs from the industry’s leading RE data lake.

Not Available

Quantarium does not have data for the current month. Please view the chart for historical values.

Average Value
Not Available
List Price
Sold Price
Create a Home Valuation Report for This Property
The Home Valuation Report is an in-depth analysis detailing your home's value as well as a comparison with similar homes in the area

Home Values in the Area

Source: Public Records

Average Home Value in this Area


Source: Public Records

Purchase History

Date Buyer Sale Price Title Company
Bruton Germany L $170,000 --
Monroe James $105,000 --
The Bank Of New York Mellon Tr $148,620 --
Finley Cassandra D $120,200 --
Dryden Ent Inc -- --
Source: Public Records

Mortgage History

Date Status Borrower Loan Amount
Open Bruton Germany L $173,655
Previous Owner Monroe James $84,000
Previous Owner Finley Cassandra D $162,882
Source: Public Records

Property History

Date Event Price Change Sq Ft Price
07/26/2018 07/26/18 Rented -- -- --
06/26/2018 06/26/18 Under Contract -- -- --
07/10/2017 07/10/17 For Rent -- -- --

Tax History Compared to Growth

Source: Public Records

Tax History

Year Tax Paid Tax Assessment Tax Assessment Total Assessment is a certain percentage of the fair market value that is determined by local assessors to be the total taxable value of land and additions on the property. Land Improvement
2024 $23 $104,138 $14,000 $90,138
2023 $23 $93,891 $10,000 $83,891
2022 $22 $71,737 $8,000 $63,737
2021 $22 $64,380 $8,000 $56,380
2020 $2,864 $59,851 $8,000 $51,851
2019 $2,871 $60,446 $8,000 $52,446
2018 $2,634 $55,738 $8,000 $47,738
2017 $1,730 $52,532 $8,000 $44,532
2016 $1,897 $50,776 $8,000 $42,776
2015 $2,935 $53,976 $11,200 $42,776
2014 $2,935 $64,549 $11,200 $53,349
2013 -- $56,509 $11,200 $45,309
Source: Public Records

Agents Affiliated with this Home

  • Section Image
See All Agents

Map