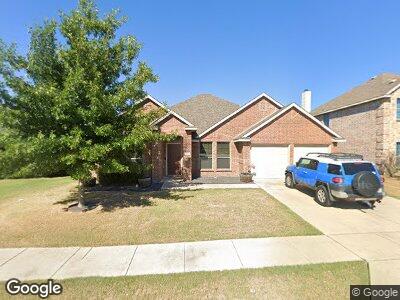
1050 Canterbury Dr Prosper, TX 75078
Estimated Value: $373,058 - $419,000
4
Beds
2
Baths
2,045
Sq Ft
$197/Sq Ft
Est. Value
About This Home
This home is located at 1050 Canterbury Dr, Prosper, TX 75078 and is currently estimated at $402,515, approximately $196 per square foot. 1050 Canterbury Dr is a home located in Denton County with nearby schools including Savannah Elementary School and Ray E Braswell High School.
Ownership History
Date
Name
Owned For
Owner Type
Purchase Details
Closed on
Aug 23, 2021
Sold by
Libby Diane Lynn and Johnson Diane
Bought by
Libby Diane Lynn and Libby Paul Scott
Current Estimated Value
Home Financials for this Owner
Home Financials are based on the most recent Mortgage that was taken out on this home.
Original Mortgage
$175,425
Outstanding Balance
$138,392
Interest Rate
2.1%
Mortgage Type
New Conventional
Estimated Equity
$264,123
Purchase Details
Closed on
May 28, 2015
Sold by
Mumford Cheryl W
Bought by
Johnson Diane
Home Financials for this Owner
Home Financials are based on the most recent Mortgage that was taken out on this home.
Original Mortgage
$204,155
Interest Rate
3.68%
Mortgage Type
New Conventional
Purchase Details
Closed on
Mar 30, 2010
Sold by
Meritage Homes Of Texas Llc
Bought by
Mumford Cheryl W
Home Financials for this Owner
Home Financials are based on the most recent Mortgage that was taken out on this home.
Original Mortgage
$168,656
Interest Rate
5%
Mortgage Type
New Conventional
Create a Home Valuation Report for This Property
The Home Valuation Report is an in-depth analysis detailing your home's value as well as a comparison with similar homes in the area
Home Values in the Area
Average Home Value in this Area
Purchase History
| Date | Buyer | Sale Price | Title Company |
|---|---|---|---|
| Libby Diane Lynn | -- | Accommodation | |
| Johnson Diane | -- | Rtt | |
| Mumford Cheryl W | -- | Stnt |
Source: Public Records
Mortgage History
| Date | Status | Borrower | Loan Amount |
|---|---|---|---|
| Open | Libby Diane Lynn | $175,425 | |
| Closed | Johnson Diane | $204,155 | |
| Previous Owner | Mumford Cheryl W | $168,656 |
Source: Public Records
Tax History Compared to Growth
Tax History
| Year | Tax Paid | Tax Assessment Tax Assessment Total Assessment is a certain percentage of the fair market value that is determined by local assessors to be the total taxable value of land and additions on the property. | Land | Improvement |
|---|---|---|---|---|
| 2024 | $6,853 | $370,497 | $108,000 | $262,497 |
| 2023 | $7,742 | $416,519 | $108,000 | $308,519 |
| 2022 | $7,008 | $338,179 | $86,400 | $251,779 |
| 2021 | $5,827 | $270,711 | $61,200 | $209,511 |
| 2020 | $5,570 | $251,455 | $61,200 | $190,255 |
| 2019 | $5,712 | $249,929 | $61,200 | $188,729 |
| 2018 | $5,782 | $251,639 | $61,200 | $190,439 |
| 2017 | $5,404 | $234,110 | $54,000 | $180,110 |
| 2016 | $4,873 | $223,554 | $46,800 | $176,754 |
| 2015 | $3,725 | $194,563 | $46,800 | $147,763 |
| 2014 | $3,725 | $169,616 | $38,448 | $131,168 |
| 2013 | -- | $158,990 | $38,448 | $120,542 |
Source: Public Records
Map
Nearby Homes
- 1813 Mercer Way
- 5720 Glencoe Dr
- 1070 Kent Dr
- 1812 Azalea Dr
- 1301 Live Oak Ln
- 1730 Azalea Dr
- 5551 Crestwood Dr
- 1309 Stone Mountain Pkwy
- 881 Lancashire Ln
- 1951 Plantation Pkwy
- 1528 Chestnut Dr
- 1524 Carriage Ln
- 810 Red Fox
- 1408 Cobblestone Ct
- 1931 Antebellum Ct
- 5470 Blue Quail Dr
- 5641 Coventry Dr
- 1508 Southern Pine Dr
- 1433 Carriage Ln
- 730 Red Fox