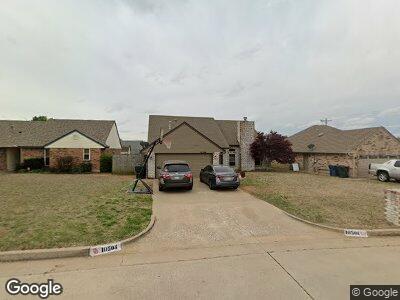
10504 Kristie Ln Oklahoma City, OK 73130
Estimated Value: $204,000 - $224,000
3
Beds
2
Baths
1,459
Sq Ft
$144/Sq Ft
Est. Value
About This Home
This home is located at 10504 Kristie Ln, Oklahoma City, OK 73130 and is currently estimated at $209,616, approximately $143 per square foot. 10504 Kristie Ln is a home located in Oklahoma County with nearby schools including Nicoma Park Elementary School, Nicoma Park Intermediate Elementary School, and Nicoma Park Middle School.
Ownership History
Date
Name
Owned For
Owner Type
Purchase Details
Closed on
Mar 12, 2025
Sold by
Kelley Jack
Bought by
Jack R Kelley 2025 Trust and Kelley
Current Estimated Value
Purchase Details
Closed on
Dec 6, 2024
Sold by
Kelley Amy J
Bought by
Kelley Jackie Ray
Home Financials for this Owner
Home Financials are based on the most recent Mortgage that was taken out on this home.
Original Mortgage
$180,708
Interest Rate
6.72%
Mortgage Type
FHA
Purchase Details
Closed on
Mar 2, 2015
Sold by
Kelley Jack Ray and Kelley Jackie Ray
Bought by
Kelley Jack Ray and Kelley Amy J
Purchase Details
Closed on
Feb 18, 1999
Sold by
Kelley Robin Lee
Bought by
Kelley Jackie Ray
Create a Home Valuation Report for This Property
The Home Valuation Report is an in-depth analysis detailing your home's value as well as a comparison with similar homes in the area
Home Values in the Area
Average Home Value in this Area
Purchase History
| Date | Buyer | Sale Price | Title Company |
|---|---|---|---|
| Jack R Kelley 2025 Trust | -- | None Listed On Document | |
| Jack R Kelley 2025 Trust | -- | None Listed On Document | |
| Kelley Jackie Ray | -- | None Listed On Document | |
| Kelley Jackie Ray | -- | None Listed On Document | |
| Kelley Jack Ray | -- | None Available | |
| Kelley Jackie Ray | -- | -- | |
| Kelley Jackie Ray | -- | -- |
Source: Public Records
Mortgage History
| Date | Status | Borrower | Loan Amount |
|---|---|---|---|
| Previous Owner | Kelley Jackie Ray | $180,708 | |
| Previous Owner | Kelley Jack Ray | $97,025 | |
| Previous Owner | Kelley Jack Ray | $21,343 |
Source: Public Records
Tax History Compared to Growth
Tax History
| Year | Tax Paid | Tax Assessment Tax Assessment Total Assessment is a certain percentage of the fair market value that is determined by local assessors to be the total taxable value of land and additions on the property. | Land | Improvement |
|---|---|---|---|---|
| 2024 | $2,217 | $18,116 | $3,284 | $14,832 |
| 2023 | $2,217 | $17,253 | $2,556 | $14,697 |
| 2022 | $2,090 | $16,432 | $2,883 | $13,549 |
| 2021 | $1,983 | $15,650 | $3,158 | $12,492 |
| 2020 | $1,903 | $14,905 | $3,251 | $11,654 |
| 2019 | $1,881 | $14,899 | $2,375 | $12,524 |
| 2018 | $1,698 | $14,190 | $0 | $0 |
| 2017 | $1,685 | $14,090 | $2,394 | $11,696 |
| 2016 | $1,618 | $13,419 | $2,402 | $11,017 |
| 2015 | $1,660 | $13,284 | $2,631 | $10,653 |
| 2014 | $1,653 | $13,167 | $2,631 | $10,536 |
Source: Public Records
Map
Nearby Homes
- 10533 Ricky Ln
- 10545 Ricky Ln
- 10306 Saint Patrick Dr
- 10305 Saint Patrick Dr
- 10816 Lejean Dr
- 10829 Ohara Ln
- 10113 Forest Ln
- 10608 Strawberry Hill
- 10107 Saint Patrick Dr
- 715 S Friendly Rd
- 1824 Haven Dr
- 700 S Friendly Rd
- 1900 S Avery Ave
- 712 S Saint Paul Ave
- 10304 Morrison Ln
- 2203 S Avery Ave
- 212 N Post Rd
- 9404 S Caldwell Dr
- 9630 E Reno Ave
- 2606 S Post Rd