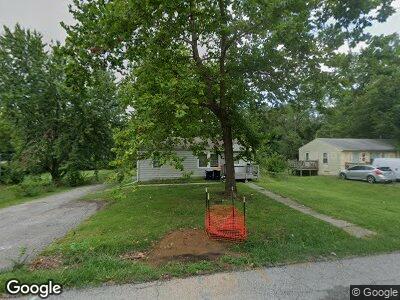
10507 Oakland Ave Kansas City, MO 64134
Hickman Mills South NeighborhoodEstimated Value: $146,919 - $163,000
3
Beds
1
Bath
912
Sq Ft
$167/Sq Ft
Est. Value
About This Home
This home is located at 10507 Oakland Ave, Kansas City, MO 64134 and is currently estimated at $152,480, approximately $167 per square foot. 10507 Oakland Ave is a home located in Jackson County with nearby schools including This Christian School.
Ownership History
Date
Name
Owned For
Owner Type
Purchase Details
Closed on
Dec 13, 2023
Sold by
T Sauk Sfr Llc
Bought by
Rainier Sfr Llc
Current Estimated Value
Home Financials for this Owner
Home Financials are based on the most recent Mortgage that was taken out on this home.
Original Mortgage
$4,086,000
Interest Rate
7.22%
Mortgage Type
Credit Line Revolving
Purchase Details
Closed on
Apr 6, 2023
Sold by
Sbd Property Acquisitions Llc
Bought by
T Sauk Sfr Llc
Purchase Details
Closed on
Apr 13, 2022
Sold by
Sbd Property Acquisitions Llc
Bought by
Pagoda 4 Llc
Purchase Details
Closed on
Dec 21, 2021
Sold by
Milburn William J and Milburn Cheryl D
Bought by
Sbd Property Aquisitions Llc
Home Financials for this Owner
Home Financials are based on the most recent Mortgage that was taken out on this home.
Original Mortgage
$117,269
Interest Rate
3.45%
Mortgage Type
New Conventional
Create a Home Valuation Report for This Property
The Home Valuation Report is an in-depth analysis detailing your home's value as well as a comparison with similar homes in the area
Home Values in the Area
Average Home Value in this Area
Purchase History
| Date | Buyer | Sale Price | Title Company |
|---|---|---|---|
| Rainier Sfr Llc | -- | None Listed On Document | |
| T Sauk Sfr Llc | -- | Stewart Title Company | |
| Pagoda 4 Llc | -- | Stewart Title Company | |
| Sbd Property Aquisitions Llc | -- | Secured Title Of Kansas City |
Source: Public Records
Mortgage History
| Date | Status | Borrower | Loan Amount |
|---|---|---|---|
| Open | T Sauk Sfr Llc | $50,000,000 | |
| Closed | Rainier Sfr Llc | $4,086,000 | |
| Previous Owner | Sbd Property Acquisitions Llc | $117,269 | |
| Previous Owner | Milburn Cheryl Denean | $20,000 |
Source: Public Records
Tax History Compared to Growth
Tax History
| Year | Tax Paid | Tax Assessment Tax Assessment Total Assessment is a certain percentage of the fair market value that is determined by local assessors to be the total taxable value of land and additions on the property. | Land | Improvement |
|---|---|---|---|---|
| 2024 | $1,172 | $13,788 | $2,613 | $11,175 |
| 2023 | $1,172 | $13,788 | $1,894 | $11,894 |
| 2022 | $1,166 | $11,780 | $2,784 | $8,996 |
| 2021 | $1,006 | $11,780 | $2,784 | $8,996 |
| 2020 | $1,068 | $11,820 | $2,784 | $9,036 |
| 2019 | $1,010 | $11,820 | $2,784 | $9,036 |
| 2018 | $1,035 | $11,307 | $2,756 | $8,551 |
| 2017 | $1,039 | $11,307 | $2,756 | $8,551 |
| 2016 | $1,039 | $11,024 | $2,544 | $8,480 |
| 2014 | $998 | $10,703 | $2,470 | $8,233 |
Source: Public Records
Map
Nearby Homes
- 10516 Corrington Ave
- 7403 E 107th St
- 10326 Smalley Ct
- 7907 E 107th St
- 7714 E 110th St
- 7508 E 102nd St
- 7610 E 102nd St
- 7800 E 111th Terrace
- 8001 E 102nd St
- 7708 E 111th Terrace
- 10802 Ewing Ave
- 10707 Bennington Ave
- 6901 E 102nd St
- 7700 E 100th St
- 10904 Cambridge Ave
- 11002 Bristol Terrace
- 10913 Ewing Ave
- 8105 E 100th Terrace Ct
- 7809 E 99th Terrace
- 10705 Beacon Ave