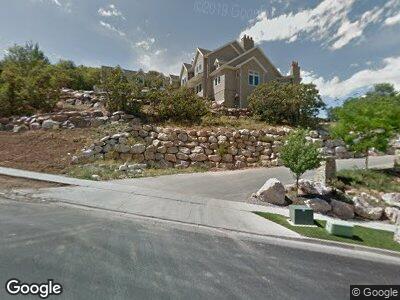
1052 Highland Oaks Dr Unit 205 Bountiful, UT 84010
Estimated Value: $2,324,000 - $3,153,437
6
Beds
6
Baths
6,313
Sq Ft
$434/Sq Ft
Est. Value
About This Home
This home is located at 1052 Highland Oaks Dr Unit 205, Bountiful, UT 84010 and is currently estimated at $2,740,609, approximately $434 per square foot. 1052 Highland Oaks Dr Unit 205 is a home located in Davis County with nearby schools including Boulton School, Mueller Park Junior High School, and Woods Cross High School.
Ownership History
Date
Name
Owned For
Owner Type
Purchase Details
Closed on
Jun 6, 2014
Sold by
Howes Jeff
Bought by
Howes Jeffrey D
Current Estimated Value
Home Financials for this Owner
Home Financials are based on the most recent Mortgage that was taken out on this home.
Original Mortgage
$1,500,000
Interest Rate
3.62%
Mortgage Type
Construction
Purchase Details
Closed on
Jun 25, 2013
Sold by
Tlc Construction Inc
Bought by
Howes Jeff
Purchase Details
Closed on
Jul 16, 2007
Sold by
Poore Jeffrey F
Bought by
Tlc Construction Inc
Purchase Details
Closed on
Feb 10, 2004
Sold by
Corporation Of The Presiding Bishop Of T
Bought by
Poore Jeffrey F
Purchase Details
Closed on
Aug 26, 2002
Sold by
Clark L H S Llc
Bought by
Corporation Of The Presiding Bishop Of T
Create a Home Valuation Report for This Property
The Home Valuation Report is an in-depth analysis detailing your home's value as well as a comparison with similar homes in the area
Home Values in the Area
Average Home Value in this Area
Purchase History
| Date | Buyer | Sale Price | Title Company |
|---|---|---|---|
| Howes Jeffrey D | -- | Mountain View Title | |
| Howes Jeff | -- | Aspen Title Insurance | |
| Tlc Construction Inc | -- | Western States Title Company | |
| Poore Jeffrey F | -- | Founders Title Co | |
| Corporation Of The Presiding Bishop Of T | -- | Founders Title Co |
Source: Public Records
Mortgage History
| Date | Status | Borrower | Loan Amount |
|---|---|---|---|
| Open | Howes Jeffrey D | $301,618 | |
| Open | Howes Jeffrey D | $1,610,000 | |
| Closed | Howes Jeffrey D | $1,500,000 |
Source: Public Records
Tax History Compared to Growth
Tax History
| Year | Tax Paid | Tax Assessment Tax Assessment Total Assessment is a certain percentage of the fair market value that is determined by local assessors to be the total taxable value of land and additions on the property. | Land | Improvement |
|---|---|---|---|---|
| 2024 | $13,077 | $1,323,170 | $327,647 | $995,523 |
| 2023 | $12,273 | $2,228,000 | $523,549 | $1,704,451 |
| 2022 | $11,492 | $1,142,350 | $255,643 | $886,707 |
| 2021 | $10,406 | $1,550,000 | $391,615 | $1,158,385 |
| 2020 | $10,510 | $1,624,000 | $262,949 | $1,361,051 |
| 2019 | $11,363 | $1,703,000 | $235,604 | $1,467,396 |
| 2018 | $9,885 | $1,475,000 | $255,759 | $1,219,241 |
| 2016 | $9,135 | $733,908 | $159,816 | $574,092 |
| 2015 | $4,638 | $357,321 | $159,816 | $197,505 |
| 2014 | $3,393 | $267,396 | $267,396 | $0 |
| 2013 | -- | $266,915 | $266,915 | $0 |
Source: Public Records
Map
Nearby Homes
- 4031 Mountain Oaks Dr Unit 308
- 1390 Canyon Creek Dr
- 367 Hidden Lake Dr
- 3893 S Bountiful Blvd
- 3777 Huntington Dr
- 3756 Cardiff Way
- 3782 Cardiff Way
- 3866 Glade Hollow Way
- 3017 S 950 E
- 3543 S 100 E
- 4757 Hidden Lake Dr
- 3463 S 50 E
- 3225 S 50 E
- 2935 S 175 E
- 2783 Irene Dr
- 141 W 3500 S
- 2898 S 150 E
- 28 N Fairway Dr
- 879 San Simeon Way
- 117 W 3000 S