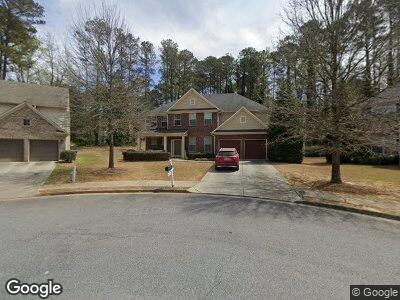
10585 Haynes Valley Ct Alpharetta, GA 30022
Willow Springs NeighborhoodEstimated Value: $816,000 - $1,193,000
3
Beds
3
Baths
3,616
Sq Ft
$262/Sq Ft
Est. Value
About This Home
This home is located at 10585 Haynes Valley Ct, Alpharetta, GA 30022 and is currently estimated at $945,896, approximately $261 per square foot. 10585 Haynes Valley Ct is a home with nearby schools including Northwood Elementary School, Haynes Bridge Middle School, and Centennial High School.
Ownership History
Date
Name
Owned For
Owner Type
Purchase Details
Closed on
May 11, 2020
Sold by
Pathikonda Nishanth
Bought by
Pathikonda Nishanth and Yamavarapu Divya
Current Estimated Value
Home Financials for this Owner
Home Financials are based on the most recent Mortgage that was taken out on this home.
Original Mortgage
$239,000
Outstanding Balance
$217,913
Interest Rate
3.5%
Mortgage Type
New Conventional
Estimated Equity
$656,652
Purchase Details
Closed on
Dec 1, 2010
Sold by
Wells Fargo Bk Na
Bought by
Ashton Atlanta Residential Llc
Home Financials for this Owner
Home Financials are based on the most recent Mortgage that was taken out on this home.
Original Mortgage
$294,344
Interest Rate
4.3%
Mortgage Type
New Conventional
Purchase Details
Closed on
Nov 29, 2010
Sold by
Ashton Atlanta Residential Llc
Bought by
Pathikonda Nishanth
Home Financials for this Owner
Home Financials are based on the most recent Mortgage that was taken out on this home.
Original Mortgage
$294,344
Interest Rate
4.3%
Mortgage Type
New Conventional
Create a Home Valuation Report for This Property
The Home Valuation Report is an in-depth analysis detailing your home's value as well as a comparison with similar homes in the area
Home Values in the Area
Average Home Value in this Area
Purchase History
| Date | Buyer | Sale Price | Title Company |
|---|---|---|---|
| Pathikonda Nishanth | -- | -- | |
| Ashton Atlanta Residential Llc | -- | -- | |
| Pathikonda Nishanth | $368,000 | -- |
Source: Public Records
Mortgage History
| Date | Status | Borrower | Loan Amount |
|---|---|---|---|
| Open | Pathikonda Nishanth | $239,000 | |
| Previous Owner | Ashton Atlanta Residential Llc | $100,000,000 | |
| Previous Owner | Pathikonda Nishanth | $294,344 |
Source: Public Records
Tax History Compared to Growth
Tax History
| Year | Tax Paid | Tax Assessment Tax Assessment Total Assessment is a certain percentage of the fair market value that is determined by local assessors to be the total taxable value of land and additions on the property. | Land | Improvement |
|---|---|---|---|---|
| 2023 | $6,294 | $223,000 | $82,960 | $140,040 |
| 2022 | $3,521 | $223,000 | $82,960 | $140,040 |
| 2021 | $6,762 | $222,000 | $49,880 | $172,120 |
| 2020 | $4,184 | $222,000 | $49,880 | $172,120 |
| 2019 | $633 | $262,520 | $49,880 | $212,640 |
| 2018 | $3,885 | $262,520 | $49,880 | $212,640 |
| 2017 | $3,995 | $157,280 | $29,040 | $128,240 |
| 2016 | $4,239 | $157,280 | $29,040 | $128,240 |
| 2015 | $4,748 | $184,120 | $29,040 | $155,080 |
| 2014 | $4,120 | $184,120 | $29,040 | $155,080 |
Source: Public Records
Map
Nearby Homes
- 230 Summerfield Dr
- 10625 Haynes Forest Dr
- 315 Stanyan Place
- 2480 Roxburgh Dr
- 10416 Park Walk Point
- 105 Kinross Ct
- 2415 Roxburgh Dr
- 230 Society St
- 3150 Berkshire Manor Dr
- 3015 Ascot Ln
- 10215 Alvin Rd
- 2732 Wander Ln
- 605 Tatum Ct
- 955 Laurel Mill Dr
- 600 Jardin Ct Unit 48
- 10350 Alvin Rd
- 655 Barrington Way Unit 2