106 Callis Cir Wilmore, KY 40390
Wilmore NeighborhoodEstimated Value: $408,935 - $501,000
3
Beds
3
Baths
2,112
Sq Ft
$208/Sq Ft
Est. Value
About This Home
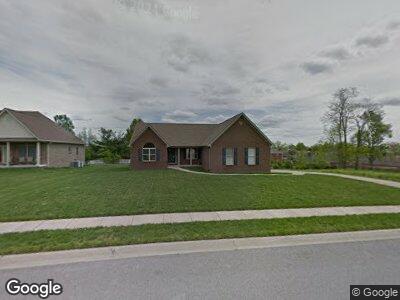
This home is located at 106 Callis Cir, Wilmore, KY 40390 and is currently estimated at $438,734, approximately $207 per square foot. 106 Callis Cir is a home located in Jessamine County with nearby schools including Wilmore Elementary School, West Jessamine Middle School, and West Jessamine High School.
Create a Home Valuation Report for This Property
The Home Valuation Report is an in-depth analysis detailing your home's value as well as a comparison with similar homes in the area
Home Values in the Area
Average Home Value in this Area
Mortgage History
| Date | Status | Borrower | Loan Amount |
|---|---|---|---|
| Closed | Sontag Dwight J | $112,000 | |
| Closed | Sontag Dwight J | $156,800 | |
| Closed | Sontag Dwight J | $163,000 |
Source: Public Records
Tax History Compared to Growth
Tax History
| Year | Tax Paid | Tax Assessment Tax Assessment Total Assessment is a certain percentage of the fair market value that is determined by local assessors to be the total taxable value of land and additions on the property. | Land | Improvement |
|---|---|---|---|---|
| 2024 | $3,356 | $365,400 | $75,600 | $289,800 |
| 2023 | $3,388 | $365,400 | $75,600 | $289,800 |
| 2022 | $2,811 | $304,500 | $63,000 | $241,500 |
| 2021 | $2,816 | $304,500 | $63,000 | $241,500 |
| 2020 | $2,832 | $304,500 | $63,000 | $241,500 |
| 2019 | $3,212 | $304,500 | $63,000 | $241,500 |
| 2018 | $2,846 | $270,000 | $60,000 | $210,000 |
| 2017 | $2,722 | $270,000 | $60,000 | $210,000 |
| 2016 | $2,722 | $270,000 | $60,000 | $210,000 |
| 2015 | $2,722 | $270,000 | $60,000 | $210,000 |
| 2014 | $2,626 | $265,000 | $55,000 | $210,000 |
Source: Public Records
Map
Nearby Homes
- 707 Brasher St
- 205 Witts Ln
- 103 Witts Ln
- 421 Akers Dr
- 143-145 Hutchins Dr
- 519 N Lexington Ave
- 126 Lesley Trail
- 105 Peaceful Landing
- 207 E Morrison St
- 1005 Cade Ct
- 200 S Walnut St
- 9412 Harrodsburg Rd
- 105 Academy Dr
- 191 Academy Dr
- 104 Wood St
- 108 Wood St
- 304 Creekside Dr
- 620 Tocher Dr
- 102 Brookwood Ln
- 279A Jessamine Station Rd