Z
Seller's Agent in 2024
Zach Wasserman
Capital Rlty Grp River Region
(334) 467-2344
2 in this area
3 Total Sales
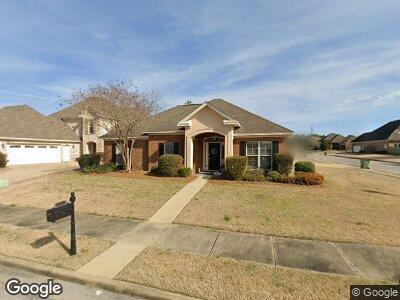
AVAILABLE OCTOBER 7th, 2024! Great 4 bedroom 2.5 bath home in Breckenridge! This beautiful home on a large corner lot and has an outstanding open floor plan with formal dining and large eat in kitchen. Kitchen has granite counter tops and luxury vinyl plank throughout the living area. Large backyard and covered patio space great for entertaining!
| Date | Buyer | Sale Price | Title Company |
|---|---|---|---|
| Wungluck Scott Jeffrey | -- | None Listed On Document | |
| Wungluck Scott | -- | None Available |
| Date | Status | Borrower | Loan Amount |
|---|---|---|---|
| Previous Owner | Wungluck Scott | $236,000 | |
| Previous Owner | Wungluck Scott | $228,800 |
| Date | Event | Price | Change | Sq Ft Price |
|---|---|---|---|---|
| 11/07/2024 11/07/24 | Rented | $2,250 | 0.0% | -- |
| 08/13/2024 08/13/24 | For Rent | $2,250 | +4.7% | -- |
| 08/02/2022 08/02/22 | Rented | $2,150 | +2.4% | -- |
| 07/29/2022 07/29/22 | For Rent | $2,100 | +31.3% | -- |
| 07/31/2020 07/31/20 | Rented | $1,600 | 0.0% | -- |
| 07/08/2020 07/08/20 | For Rent | $1,600 | 0.0% | -- |
| 04/18/2018 04/18/18 | Rented | $1,600 | 0.0% | -- |
| 04/18/2018 04/18/18 | For Rent | $1,600 | 0.0% | -- |
| 10/21/2016 10/21/16 | Rented | $1,600 | 0.0% | -- |
| 09/21/2016 09/21/16 | Under Contract | -- | -- | -- |
| 09/09/2016 09/09/16 | For Rent | $1,600 | -- | -- |
| Year | Tax Paid | Tax Assessment Tax Assessment Total Assessment is a certain percentage of the fair market value that is determined by local assessors to be the total taxable value of land and additions on the property. | Land | Improvement |
|---|---|---|---|---|
| 2024 | $3,673 | $75,500 | $9,000 | $66,500 |
| 2023 | $3,673 | $66,620 | $9,000 | $57,620 |
| 2022 | $2,139 | $58,600 | $7,000 | $51,600 |
| 2021 | $1,993 | $54,600 | $7,000 | $47,600 |
| 2020 | $1,980 | $54,260 | $7,000 | $47,260 |
| 2019 | $1,967 | $53,880 | $7,000 | $46,880 |
| 2018 | $1,919 | $52,580 | $0 | $0 |
| 2017 | $1,907 | $52,240 | $7,280 | $44,960 |
| 2014 | $1,810 | $49,600 | $7,000 | $42,600 |
| 2013 | -- | $45,260 | $8,000 | $37,260 |
Z
Seller's Agent in 2024
Zach Wasserman
Capital Rlty Grp River Region
(334) 467-2344
2 in this area
3 Total Sales

Seller's Agent in 2022
Jeff Wasserman
Capital Rlty Grp River Region
(334) 590-1883
24 in this area
37 Total Sales