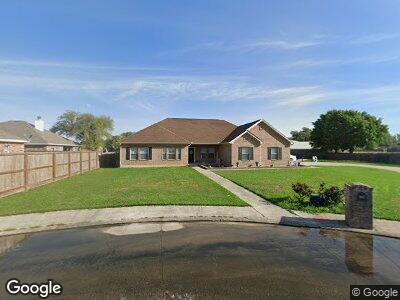
1062 Jordan Ct Bridge City, TX 77611
East Orange NeighborhoodEstimated Value: $247,000 - $375,000
4
Beds
2
Baths
2,166
Sq Ft
$145/Sq Ft
Est. Value
About This Home
This home is located at 1062 Jordan Ct, Bridge City, TX 77611 and is currently estimated at $314,699, approximately $145 per square foot. 1062 Jordan Ct is a home located in Orange County with nearby schools including Bridge City Elementary School, Bridge City Intermediate School, and Bridge City Middle School.
Ownership History
Date
Name
Owned For
Owner Type
Purchase Details
Closed on
Jun 22, 2022
Sold by
Trae Pellegrin
Bought by
Thibodaux Bradley M and Thibodaux Deanna M
Current Estimated Value
Home Financials for this Owner
Home Financials are based on the most recent Mortgage that was taken out on this home.
Original Mortgage
$255,920
Outstanding Balance
$245,948
Interest Rate
5.3%
Mortgage Type
New Conventional
Estimated Equity
$68,751
Purchase Details
Closed on
Jul 8, 2020
Sold by
Leslie Justin and Leslie Cristy
Bought by
Pellegrin Trae and Pellegrin Veronica
Home Financials for this Owner
Home Financials are based on the most recent Mortgage that was taken out on this home.
Original Mortgage
$267,900
Interest Rate
3.1%
Mortgage Type
New Conventional
Purchase Details
Closed on
Aug 19, 2016
Sold by
Robertson David A and Robertson Pamela M
Bought by
Leslie Cristy
Home Financials for this Owner
Home Financials are based on the most recent Mortgage that was taken out on this home.
Original Mortgage
$208,945
Interest Rate
3.87%
Mortgage Type
FHA
Purchase Details
Closed on
Aug 18, 2010
Sold by
Compass Bank
Bought by
Leslie Cristy
Purchase Details
Closed on
Mar 3, 2009
Sold by
Whaley Custom Homes Inc
Bought by
Compass Bank
Create a Home Valuation Report for This Property
The Home Valuation Report is an in-depth analysis detailing your home's value as well as a comparison with similar homes in the area
Home Values in the Area
Average Home Value in this Area
Purchase History
| Date | Buyer | Sale Price | Title Company |
|---|---|---|---|
| Thibodaux Bradley M | -- | Capital Title | |
| Pellegrin Trae | -- | Capital Title | |
| Leslie Cristy | -- | Stc | |
| Leslie Cristy | -- | -- | |
| Compass Bank | $100,000 | Bank Phares |
Source: Public Records
Mortgage History
| Date | Status | Borrower | Loan Amount |
|---|---|---|---|
| Open | Thibodaux Bradley M | $255,920 | |
| Previous Owner | Pellegrin Trae | $267,900 | |
| Previous Owner | Leslie Cristy | $208,945 | |
| Previous Owner | Whaley Custom Homes Inc | $142,000 |
Source: Public Records
Tax History Compared to Growth
Tax History
| Year | Tax Paid | Tax Assessment Tax Assessment Total Assessment is a certain percentage of the fair market value that is determined by local assessors to be the total taxable value of land and additions on the property. | Land | Improvement |
|---|---|---|---|---|
| 2024 | $7,817 | $353,070 | $48,635 | $304,435 |
| 2023 | $7,708 | $343,529 | $48,635 | $294,894 |
| 2022 | $6,009 | $309,085 | $48,635 | $260,450 |
| 2021 | $6,746 | $284,375 | $48,635 | $235,740 |
| 2020 | $6,138 | $252,175 | $48,635 | $203,540 |
| 2019 | $6,091 | $243,847 | $48,635 | $195,212 |
| 2018 | $5,742 | $234,322 | $48,635 | $185,687 |
| 2017 | $5,358 | $255,165 | $69,478 | $185,687 |
| 2016 | $5,032 | $204,316 | $37,135 | $171,934 |
| 2015 | $3,332 | $185,742 | $37,135 | $167,384 |
| 2014 | $3,332 | $168,856 | $0 | $0 |
Source: Public Records
Map
Nearby Homes
- 285 Circle Dr
- 305 Elizabeth St
- 319 Dixie Dr
- 445 Bland Dr
- 004 Dove Ct
- 220 Charles Ave
- 170 Bailey Ave
- 200 Crepe Myrtle Ave
- 108 Woodsong St
- 605 Alexandria Ln
- 320 Warner St
- 320 Henry St
- 435 Blueberry St
- 445 Blueberry St
- 385 Warner St
- 1274 Bourbon St
- 380 Silver Bridge Ct
- 318 Bell Ave
- 320 Bell Ave
- 275 E Clover Dr