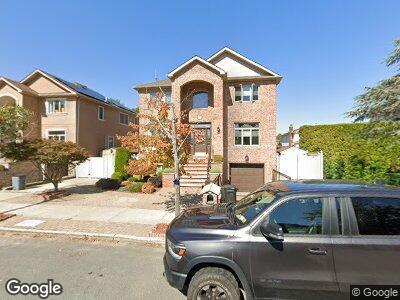
1065-1071 Edgegrove Ave Staten Island, NY 10309
Woodrow NeighborhoodEstimated Value: $1,399,000 - $1,592,000
--
Bed
--
Bath
3,080
Sq Ft
$478/Sq Ft
Est. Value
About This Home
This home is located at 1065-1071 Edgegrove Ave, Staten Island, NY 10309 and is currently estimated at $1,472,391, approximately $478 per square foot. 1065-1071 Edgegrove Ave is a home located in Richmond County with nearby schools including Kathleen Grimm School For Leadership, P.S. 3 - The Margaret Gioiosa School, and Is 34 Tottenville.
Ownership History
Date
Name
Owned For
Owner Type
Purchase Details
Closed on
Dec 6, 2023
Sold by
Gargin John and Gargin Rosemary
Bought by
Wu Yon and You Kaiming
Current Estimated Value
Home Financials for this Owner
Home Financials are based on the most recent Mortgage that was taken out on this home.
Original Mortgage
$673,000
Outstanding Balance
$666,427
Interest Rate
7.63%
Mortgage Type
New Conventional
Estimated Equity
$834,348
Purchase Details
Closed on
Mar 5, 2014
Sold by
Gargin John
Bought by
Gargin John and Gargin Rosemary
Purchase Details
Closed on
Apr 23, 2007
Sold by
Gargin John and Pellegriti Franco
Bought by
Gargin John
Home Financials for this Owner
Home Financials are based on the most recent Mortgage that was taken out on this home.
Original Mortgage
$290,000
Interest Rate
6.17%
Mortgage Type
Stand Alone Refi Refinance Of Original Loan
Create a Home Valuation Report for This Property
The Home Valuation Report is an in-depth analysis detailing your home's value as well as a comparison with similar homes in the area
Home Values in the Area
Average Home Value in this Area
Purchase History
| Date | Buyer | Sale Price | Title Company |
|---|---|---|---|
| Wu Yon | $1,347,000 | Stewart Title | |
| Gargin John | -- | None Available | |
| Gargin John | -- | First Amer Title Ins Co Ny |
Source: Public Records
Mortgage History
| Date | Status | Borrower | Loan Amount |
|---|---|---|---|
| Open | Wu Yon | $673,000 | |
| Previous Owner | Gargin John | $230,000 | |
| Previous Owner | Gargin John | $100,000 | |
| Previous Owner | Gargin John | $335,500 | |
| Previous Owner | Gargin John | $290,000 |
Source: Public Records
Tax History Compared to Growth
Tax History
| Year | Tax Paid | Tax Assessment Tax Assessment Total Assessment is a certain percentage of the fair market value that is determined by local assessors to be the total taxable value of land and additions on the property. | Land | Improvement |
|---|---|---|---|---|
| 2024 | $13,827 | $81,300 | $13,667 | $67,633 |
| 2023 | $13,438 | $67,566 | $12,013 | $55,553 |
| 2022 | $12,438 | $73,860 | $16,140 | $57,720 |
| 2021 | $12,353 | $72,420 | $16,140 | $56,280 |
| 2020 | $11,848 | $68,940 | $16,140 | $52,800 |
| 2019 | $11,708 | $66,720 | $16,140 | $50,580 |
| 2018 | $11,180 | $56,305 | $14,849 | $41,456 |
| 2017 | $10,529 | $53,119 | $15,983 | $37,136 |
| 2016 | $8,706 | $50,113 | $14,912 | $35,201 |
| 2015 | -- | $47,808 | $11,859 | $35,949 |
| 2014 | -- | $47,808 | $13,188 | $34,620 |
Source: Public Records
Map
Nearby Homes
- 1051 Edgegrove Ave
- 1044 Edgegrove Ave
- 634 Darlington Ave
- 626 Ramona Ave
- 1888 Drumgoole Rd W
- 994 Rensselaer Ave
- 909 Rathbun Ave
- 933 Edgegrove Ave
- 1010 Sheldon Ave
- 185 Foster Rd
- 859 Lamont Ave
- 935 Sheldon Ave
- 436 Ashland Ave
- 1090 Sheldon Ave
- 455 Darlington Ave
- 1083 Sheldon Ave
- 296 Ashland Ave
- 434 Darlington Ave
- 896 Stafford Ave
- 872 Edgegrove Ave