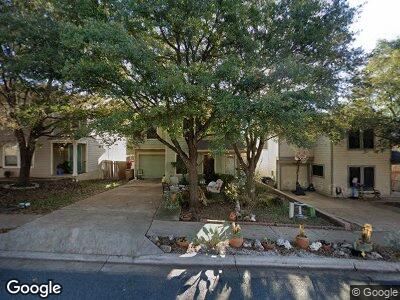
10705 Garbacz Dr Austin, TX 78748
Slaughter Creek NeighborhoodEstimated Value: $373,880 - $392,000
4
Beds
2
Baths
1,680
Sq Ft
$228/Sq Ft
Est. Value
About This Home
This home is located at 10705 Garbacz Dr, Austin, TX 78748 and is currently estimated at $382,940, approximately $227 per square foot. 10705 Garbacz Dr is a home located in Travis County with nearby schools including Kocurek Elementary School, Bailey Middle School, and Akins High School.
Ownership History
Date
Name
Owned For
Owner Type
Purchase Details
Closed on
Dec 4, 2024
Sold by
Sabbia Lp
Bought by
Herrera Martha
Current Estimated Value
Purchase Details
Closed on
Mar 22, 2011
Sold by
Morris Alex
Bought by
Sabbia Lp
Purchase Details
Closed on
Jan 28, 2011
Sold by
Sellan Donovan M and Martinez Sellan Sandra
Bought by
Morris Alex
Purchase Details
Closed on
Jul 12, 2006
Sold by
Veard Kenneth A and Veard Kristina
Bought by
Sellan Donovan M and Martinez Sellan Sandra
Home Financials for this Owner
Home Financials are based on the most recent Mortgage that was taken out on this home.
Original Mortgage
$103,600
Interest Rate
6.62%
Mortgage Type
Purchase Money Mortgage
Purchase Details
Closed on
Oct 15, 2001
Sold by
Kb Home Lone Star Lp
Bought by
Veard Kenneth A
Home Financials for this Owner
Home Financials are based on the most recent Mortgage that was taken out on this home.
Original Mortgage
$130,478
Interest Rate
6.71%
Mortgage Type
FHA
Create a Home Valuation Report for This Property
The Home Valuation Report is an in-depth analysis detailing your home's value as well as a comparison with similar homes in the area
Home Values in the Area
Average Home Value in this Area
Purchase History
| Date | Buyer | Sale Price | Title Company |
|---|---|---|---|
| Sabbia Lp | -- | Atc | |
| Morris Alex | -- | Austin Title Company | |
| Sellan Donovan M | -- | North American Title | |
| Veard Kenneth A | -- | -- |
Source: Public Records
Mortgage History
| Date | Status | Borrower | Loan Amount |
|---|---|---|---|
| Previous Owner | Sellan Donovan M | $103,600 | |
| Previous Owner | Veard Kenneth A | $130,478 |
Source: Public Records
Tax History Compared to Growth
Tax History
| Year | Tax Paid | Tax Assessment Tax Assessment Total Assessment is a certain percentage of the fair market value that is determined by local assessors to be the total taxable value of land and additions on the property. | Land | Improvement |
|---|---|---|---|---|
| 2023 | $7,502 | $414,635 | $150,000 | $264,635 |
| 2022 | $7,823 | $396,129 | $150,000 | $246,129 |
| 2021 | $6,407 | $294,352 | $75,000 | $219,352 |
| 2020 | $5,210 | $242,900 | $75,000 | $167,900 |
| 2018 | $4,555 | $205,750 | $75,000 | $130,750 |
| 2017 | $5,195 | $218,282 | $40,000 | $178,282 |
| 2016 | $4,286 | $192,165 | $40,000 | $152,165 |
| 2015 | $3,607 | $180,025 | $40,000 | $140,025 |
| 2014 | $3,607 | $152,609 | $40,000 | $112,609 |
Source: Public Records
Map
Nearby Homes
- 10516 Garbacz Dr
- 10715 Razil Ct
- 1505 Curameng Cove
- 10918 Old Manchaca Rd
- 10923 Old Manchaca Rd
- 10509 Wylie Dr Unit 338
- 10508 Wylie Dr
- 911 Penion Dr
- 10731 Menchaca Rd
- 10808 Slaughter Creek Dr
- 1112 Winifred Dr
- 10504 Bilbrook Place
- 1837 Friars Tale Ln
- 1605 Redwater Dr Unit 153
- 1817 Friars Tale Ln
- 10310 Bilbrook Place
- 10214 Bilbrook Place
- 2032 Boyds Way
- 2009 Kaiser Dr
- 10704 Watchful Fox Dr