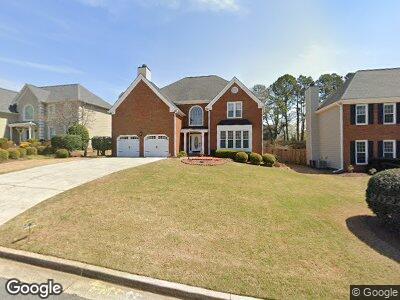
10730 S Kimball Bridge Crossing Unit CRS Alpharetta, GA 30022
Estimated Value: $677,000 - $717,352
4
Beds
3
Baths
3,014
Sq Ft
$232/Sq Ft
Est. Value
About This Home
This home is located at 10730 S Kimball Bridge Crossing Unit CRS, Alpharetta, GA 30022 and is currently estimated at $697,838, approximately $231 per square foot. 10730 S Kimball Bridge Crossing Unit CRS is a home located in Fulton County with nearby schools including Ocee Elementary School, Taylor Road Middle School, and Chattahoochee High School.
Ownership History
Date
Name
Owned For
Owner Type
Purchase Details
Closed on
Jun 25, 2003
Sold by
Tweddle Mary A and Tweddle Thomas M
Bought by
Kokilakumar Sinniah R and Kokilakumar Vanathie
Current Estimated Value
Home Financials for this Owner
Home Financials are based on the most recent Mortgage that was taken out on this home.
Original Mortgage
$215,000
Interest Rate
5.3%
Mortgage Type
New Conventional
Create a Home Valuation Report for This Property
The Home Valuation Report is an in-depth analysis detailing your home's value as well as a comparison with similar homes in the area
Home Values in the Area
Average Home Value in this Area
Purchase History
| Date | Buyer | Sale Price | Title Company |
|---|---|---|---|
| Kokilakumar Sinniah R | $245,000 | -- |
Source: Public Records
Mortgage History
| Date | Status | Borrower | Loan Amount |
|---|---|---|---|
| Open | Kokilakumar Sinniah R | $183,300 | |
| Closed | Kokilakumar Sinniah R | $215,000 |
Source: Public Records
Tax History Compared to Growth
Tax History
| Year | Tax Paid | Tax Assessment Tax Assessment Total Assessment is a certain percentage of the fair market value that is determined by local assessors to be the total taxable value of land and additions on the property. | Land | Improvement |
|---|---|---|---|---|
| 2023 | $7,028 | $249,000 | $39,040 | $209,960 |
| 2022 | $3,230 | $182,000 | $31,120 | $150,880 |
| 2021 | $3,768 | $159,960 | $27,880 | $132,080 |
| 2020 | $3,788 | $158,080 | $27,880 | $130,200 |
| 2019 | $506 | $121,560 | $25,080 | $96,480 |
| 2018 | $3,090 | $121,560 | $25,080 | $96,480 |
| 2017 | $3,177 | $121,560 | $25,080 | $96,480 |
| 2016 | $3,160 | $121,560 | $25,080 | $96,480 |
| 2015 | $3,656 | $121,000 | $25,080 | $95,920 |
| 2014 | $2,525 | $95,120 | $17,120 | $78,000 |
Source: Public Records
Map
Nearby Homes
- 405 N Pine Dr
- 340 Kincardine Way
- 3605 Grey Abbey Dr
- 115 Parkside Close
- 4180 Pineset Dr
- 10460 Cranchester Way
- 10440 Cranchester Way Unit 2
- 10825 Pinewalk Forest Cir
- 325 N Saint Phillip Ln
- 850 Highland Bend Cove
- 3602 Cape York Trace
- 10540 Willow View Cir Unit 2
- 10925 Pinehigh Dr
- 426 Vera Park Place
- 10945 Pinehigh Dr
- 870 Longstone Landing
- 10900 Wittenridge Dr Unit I4
- 10900 Wittenridge Dr Unit C1
- 10900 Wittenridge Dr Unit D5