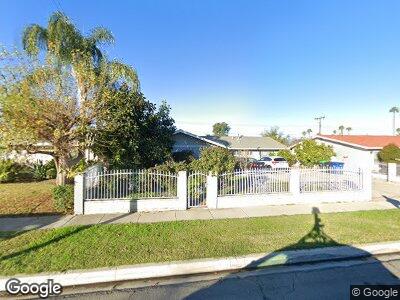
10740 Lilac Ave Loma Linda, CA 92354
North Central NeighborhoodEstimated Value: $542,790 - $685,000
3
Beds
2
Baths
1,964
Sq Ft
$312/Sq Ft
Est. Value
About This Home
This home is located at 10740 Lilac Ave, Loma Linda, CA 92354 and is currently estimated at $612,448, approximately $311 per square foot. 10740 Lilac Ave is a home located in San Bernardino County with nearby schools including Mission Elementary School, Cope Middle School, and Redlands Senior High School.
Ownership History
Date
Name
Owned For
Owner Type
Purchase Details
Closed on
Jun 23, 2017
Sold by
Strade Elizabeth I and Strade Elizabeth
Bought by
Strade Elizabeth I
Current Estimated Value
Purchase Details
Closed on
Aug 19, 2004
Sold by
Strade Richard S
Bought by
Strade Elizabeth I
Purchase Details
Closed on
Jul 10, 1997
Sold by
Takahashi Yutaka K and Takahashi Yuko Yuko
Bought by
Strade Richard Samuel and Strade Elizabeth
Home Financials for this Owner
Home Financials are based on the most recent Mortgage that was taken out on this home.
Original Mortgage
$97,000
Interest Rate
7.83%
Mortgage Type
VA
Create a Home Valuation Report for This Property
The Home Valuation Report is an in-depth analysis detailing your home's value as well as a comparison with similar homes in the area
Home Values in the Area
Average Home Value in this Area
Purchase History
| Date | Buyer | Sale Price | Title Company |
|---|---|---|---|
| Strade Elizabeth I | -- | None Available | |
| Strade Elizabeth I | -- | -- | |
| Strade Richard Samuel | $97,909 | First American Title Ins Co |
Source: Public Records
Mortgage History
| Date | Status | Borrower | Loan Amount |
|---|---|---|---|
| Open | Elizabeth I Strade Trust | $259,000 | |
| Closed | Strade Elizabeth I | $114,049 | |
| Closed | Strade Elizabeth I | $140,000 | |
| Closed | Strade Elizabeth I | $200,000 | |
| Closed | Strade Elizabeth I | $25,000 | |
| Closed | Strade Richard Samuel | $47,000 | |
| Closed | Strade Richard Samuel | $117,000 | |
| Closed | Strade Richard Samuel | $124,000 | |
| Closed | Strade Richard Samuel | $30,543 | |
| Closed | Strade Richard Samuel | $97,000 |
Source: Public Records
Tax History Compared to Growth
Tax History
| Year | Tax Paid | Tax Assessment Tax Assessment Total Assessment is a certain percentage of the fair market value that is determined by local assessors to be the total taxable value of land and additions on the property. | Land | Improvement |
|---|---|---|---|---|
| 2024 | $1,858 | $152,878 | $31,308 | $121,570 |
| 2023 | $1,856 | $149,880 | $30,694 | $119,186 |
| 2022 | $1,829 | $146,941 | $30,092 | $116,849 |
| 2021 | $1,862 | $144,060 | $29,502 | $114,558 |
| 2020 | $1,835 | $142,582 | $29,199 | $113,383 |
| 2019 | $1,785 | $139,786 | $28,626 | $111,160 |
| 2018 | $1,741 | $137,045 | $28,065 | $108,980 |
| 2017 | $1,640 | $134,358 | $27,515 | $106,843 |
| 2016 | $1,621 | $131,723 | $26,975 | $104,748 |
| 2015 | $1,608 | $129,745 | $26,570 | $103,175 |
| 2014 | $1,578 | $127,204 | $26,050 | $101,154 |
Source: Public Records
Map
Nearby Homes
- 25341 Cottage Ave
- 25539 Lane St
- 25368 Cole St Unit 3
- 25588 Lane St
- 25432 Cole St
- 10679 Seamont Dr
- 25422 Cole St
- 25461 Cole St
- 25461 Cole St Unit 3
- 11096 Willis Dr
- 25526 Redlands Blvd Unit 30
- 10663 Mountain View Ave
- 25781 Amapolas St
- 1945 S Pepper Tree Ln
- 11174 Richmont Rd
- 11180 Richmont Rd
- 0 Laurelwood Dr
- 10848 Pepper Way
- 25642 Rosewood Dr
- 10388 Mountain View Ave