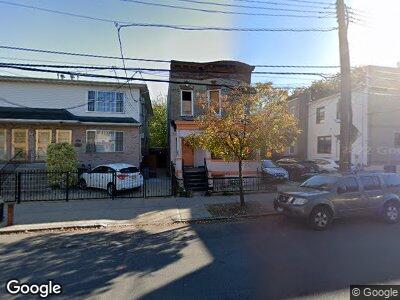
1080 Sutter Ave Brooklyn, NY 11208
East New York NeighborhoodEstimated Value: $702,000 - $943,000
6
Beds
3
Baths
2,048
Sq Ft
$401/Sq Ft
Est. Value
About This Home
This home is located at 1080 Sutter Ave, Brooklyn, NY 11208 and is currently estimated at $820,863, approximately $400 per square foot. 1080 Sutter Ave is a home located in Kings County with nearby schools including East New York Elementary School Of Excellence, Achievement First Aspire Charter, and East Brooklyn Ascend.
Ownership History
Date
Name
Owned For
Owner Type
Purchase Details
Closed on
Apr 25, 2022
Sold by
1080 Sutter Llc
Bought by
Rodney Jim
Current Estimated Value
Home Financials for this Owner
Home Financials are based on the most recent Mortgage that was taken out on this home.
Original Mortgage
$450,000
Outstanding Balance
$431,285
Interest Rate
5.3%
Mortgage Type
Unknown
Estimated Equity
$389,578
Purchase Details
Closed on
Mar 30, 2022
Sold by
Rodney Jim
Bought by
Eastern Parkway Works Llc
Purchase Details
Closed on
Jan 3, 2019
Sold by
Bsd 276 Llc
Bought by
1080 Sutter Llc
Purchase Details
Closed on
May 15, 2015
Sold by
Rodney Jim
Bought by
Bsd 276 Llc
Purchase Details
Closed on
Jun 3, 2008
Sold by
Tomaselli Dolores A
Bought by
Tomaselli Dolores A and Tomaselli Lynn M
Purchase Details
Closed on
Nov 14, 2001
Sold by
Peart Harold T Heophilu
Bought by
Rodney Jim
Home Financials for this Owner
Home Financials are based on the most recent Mortgage that was taken out on this home.
Original Mortgage
$174,582
Interest Rate
6.66%
Create a Home Valuation Report for This Property
The Home Valuation Report is an in-depth analysis detailing your home's value as well as a comparison with similar homes in the area
Home Values in the Area
Average Home Value in this Area
Purchase History
| Date | Buyer | Sale Price | Title Company |
|---|---|---|---|
| Rodney Jim | -- | -- | |
| Eastern Parkway Works Llc | $250,000 | -- | |
| 1080 Sutter Llc | -- | -- | |
| Bsd 276 Llc | $30,000 | -- | |
| Tomaselli Dolores A | -- | -- | |
| Rodney Jim | -- | -- |
Source: Public Records
Mortgage History
| Date | Status | Borrower | Loan Amount |
|---|---|---|---|
| Open | Eastern Parkway Works Llc | $205,000 | |
| Open | Eastern Parkway Works Llc | $450,000 | |
| Previous Owner | Rodney Jim | $416,000 | |
| Previous Owner | Rodney Jim | $140,000 | |
| Previous Owner | Rodney Jim | $174,582 |
Source: Public Records
Tax History Compared to Growth
Tax History
| Year | Tax Paid | Tax Assessment Tax Assessment Total Assessment is a certain percentage of the fair market value that is determined by local assessors to be the total taxable value of land and additions on the property. | Land | Improvement |
|---|---|---|---|---|
| 2024 | $3,332 | $44,880 | $10,080 | $34,800 |
| 2023 | $3,179 | $49,320 | $10,080 | $39,240 |
| 2022 | $2,954 | $41,700 | $10,080 | $31,620 |
| 2021 | $2,940 | $39,960 | $10,080 | $29,880 |
| 2020 | $1,462 | $48,420 | $10,080 | $38,340 |
| 2019 | $2,892 | $45,720 | $10,080 | $35,640 |
| 2018 | $2,659 | $13,046 | $2,907 | $10,139 |
| 2017 | $2,513 | $12,330 | $3,634 | $8,696 |
| 2016 | $2,328 | $11,643 | $3,670 | $7,973 |
| 2015 | $1,403 | $11,643 | $3,181 | $8,462 |
| 2014 | $1,403 | $11,520 | $3,610 | $7,910 |
Source: Public Records
Map
Nearby Homes
- 307 Berriman St Unit 307A
- 294 Berriman St
- 265 Berriman St
- 319 Atkins Ave
- 258 Atkins Ave
- 1071 Blake Ave
- 283 Montauk Ave
- 301 Montauk Ave
- 306 Milford St
- 224 Berriman St
- 303 Milford St
- 1114 Blake Ave
- 368 Atkins Ave
- 1140 Sutter Ave
- 321 Milford St
- 372 Atkins Ave
- 333 Milford St
- 210 Atkins Ave
- 210 Montauk Ave
- 368 Milford St