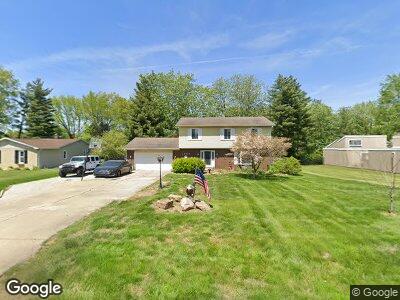
1086 E Curry Dr Terre Haute, IN 47802
Estimated Value: $199,000 - $261,000
4
Beds
3
Baths
1,998
Sq Ft
$117/Sq Ft
Est. Value
About This Home
This home is located at 1086 E Curry Dr, Terre Haute, IN 47802 and is currently estimated at $233,479, approximately $116 per square foot. 1086 E Curry Dr is a home located in Vigo County with nearby schools including Dixie Bee Elementary School, Honey Creek Middle School, and Terre Haute South Vigo High School.
Ownership History
Date
Name
Owned For
Owner Type
Purchase Details
Closed on
Jun 15, 2012
Sold by
Livingston Maryse C
Bought by
Gigante Christopher N and Gigante Cindy
Current Estimated Value
Home Financials for this Owner
Home Financials are based on the most recent Mortgage that was taken out on this home.
Original Mortgage
$114,880
Outstanding Balance
$80,724
Interest Rate
3.75%
Mortgage Type
FHA
Estimated Equity
$152,755
Purchase Details
Closed on
Oct 26, 2007
Sold by
Holman William C and Holman Kathleen J
Bought by
Livingston Maryse C
Home Financials for this Owner
Home Financials are based on the most recent Mortgage that was taken out on this home.
Original Mortgage
$124,900
Interest Rate
6.38%
Mortgage Type
New Conventional
Create a Home Valuation Report for This Property
The Home Valuation Report is an in-depth analysis detailing your home's value as well as a comparison with similar homes in the area
Home Values in the Area
Average Home Value in this Area
Purchase History
| Date | Buyer | Sale Price | Title Company |
|---|---|---|---|
| Gigante Christopher N | -- | Hone Creek Vigo Title Svcs I | |
| Livingston Maryse C | -- | -- |
Source: Public Records
Mortgage History
| Date | Status | Borrower | Loan Amount |
|---|---|---|---|
| Open | Gigante Christopher N | $30,000 | |
| Open | Gigante Christopher N | $114,880 | |
| Previous Owner | Livingston Maryse C | $124,850 | |
| Previous Owner | Livingston Maryse C | $124,900 |
Source: Public Records
Tax History Compared to Growth
Tax History
| Year | Tax Paid | Tax Assessment Tax Assessment Total Assessment is a certain percentage of the fair market value that is determined by local assessors to be the total taxable value of land and additions on the property. | Land | Improvement |
|---|---|---|---|---|
| 2024 | $1,834 | $170,900 | $28,100 | $142,800 |
| 2023 | $1,763 | $163,100 | $28,100 | $135,000 |
| 2022 | $1,650 | $155,000 | $28,100 | $126,900 |
| 2021 | $1,534 | $144,400 | $27,500 | $116,900 |
| 2020 | $1,508 | $143,300 | $27,300 | $116,000 |
| 2019 | $1,476 | $140,500 | $26,700 | $113,800 |
| 2018 | $2,031 | $135,400 | $26,000 | $109,400 |
| 2017 | $1,331 | $136,100 | $25,700 | $110,400 |
| 2016 | $1,335 | $133,500 | $25,200 | $108,300 |
| 2014 | $1,209 | $125,700 | $24,200 | $101,500 |
| 2013 | $1,209 | $124,400 | $24,000 | $100,400 |
Source: Public Records
Map
Nearby Homes
- 21 E Wapiti Dr
- 22 S Elks St
- 7251 Woodcraft Ct
- 849 Sunrise Ct
- 1897 E Crystal Creek Dr
- 166 Allendale Ct
- 77 Allendale
- 51 Southridge Rd
- 47 Edgewood Ct
- 61 Allendale
- 99 Forest Glen Ct
- 14 E Fairway Dr
- 316 Hickory Hill Dr
- 5000 Block S Us Hwy 41
- 1129 E Wood Ln
- 6021 S Sullivan Place
- 1150 E Harlan Dr
- 5169 S Glenn St
- 921 Windsor Rd
- 901 E Azalia Dr