10862 Tiberio Dr Fort Myers, FL 33913
Pelican Preserve NeighborhoodEstimated Value: $591,000 - $672,000
3
Beds
3
Baths
2,246
Sq Ft
$285/Sq Ft
Est. Value
About This Home
This home is located at 10862 Tiberio Dr, Fort Myers, FL 33913 and is currently estimated at $639,878, approximately $284 per square foot. 10862 Tiberio Dr is a home located in Lee County with nearby schools including Gateway Elementary School, Tice Elementary School, and Orange River Elementary School.
Ownership History
Date
Name
Owned For
Owner Type
Purchase Details
Closed on
May 28, 2021
Sold by
Gallucci Patricia Marie and Gallucci Gary Alfred
Bought by
Solywoda Brian A
Current Estimated Value
Home Financials for this Owner
Home Financials are based on the most recent Mortgage that was taken out on this home.
Original Mortgage
$349,000
Outstanding Balance
$320,753
Interest Rate
2.9%
Mortgage Type
New Conventional
Estimated Equity
$315,472
Purchase Details
Closed on
Feb 8, 2019
Sold by
Gailucci Patricia Marie and Gailucci Gary Lafred
Bought by
Gallucci Patricia Marie and Gallucci Alfred Gary
Purchase Details
Closed on
Apr 24, 2007
Sold by
Bay Colony Gateway Inc
Bought by
Gallucci Gary A and Gallucci Patricia M
Home Financials for this Owner
Home Financials are based on the most recent Mortgage that was taken out on this home.
Original Mortgage
$334,480
Interest Rate
6.12%
Mortgage Type
Purchase Money Mortgage
Create a Home Valuation Report for This Property
The Home Valuation Report is an in-depth analysis detailing your home's value as well as a comparison with similar homes in the area
Home Values in the Area
Average Home Value in this Area
Purchase History
| Date | Buyer | Sale Price | Title Company |
|---|---|---|---|
| Solywoda Brian A | $439,000 | Attorney | |
| Gallucci Patricia Marie | -- | Attorney | |
| Gallucci Gary A | $418,100 | Dba Wci Title |
Source: Public Records
Mortgage History
| Date | Status | Borrower | Loan Amount |
|---|---|---|---|
| Open | Solywoda Brian A | $349,000 | |
| Previous Owner | Gallucci Gary A | $100,000 | |
| Previous Owner | Gallucci Gary A | $334,480 |
Source: Public Records
Tax History Compared to Growth
Tax History
| Year | Tax Paid | Tax Assessment Tax Assessment Total Assessment is a certain percentage of the fair market value that is determined by local assessors to be the total taxable value of land and additions on the property. | Land | Improvement |
|---|---|---|---|---|
| 2024 | $10,509 | $563,472 | -- | -- |
| 2023 | $10,509 | $512,247 | $100,395 | $380,085 |
| 2022 | $9,314 | $417,685 | $198,952 | $218,733 |
| 2021 | $7,026 | $285,474 | $66,335 | $219,139 |
| 2020 | $6,901 | $274,541 | $65,100 | $209,441 |
| 2019 | $6,743 | $268,887 | $60,700 | $208,187 |
| 2018 | $5,543 | $244,995 | $0 | $0 |
| 2017 | $5,475 | $239,956 | $0 | $0 |
| 2016 | $5,431 | $278,005 | $55,000 | $223,005 |
| 2015 | $5,450 | $278,777 | $53,000 | $225,777 |
| 2014 | $5,419 | $241,213 | $50,000 | $191,213 |
| 2013 | -- | $235,581 | $31,000 | $204,581 |
Source: Public Records
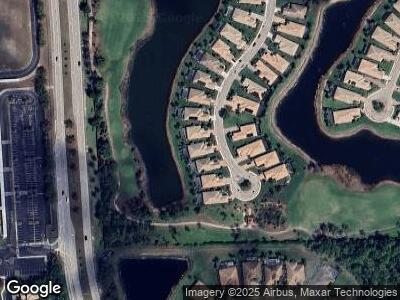
Map
Nearby Homes
- 10852 Tiberio Dr
- 10640 Highgrove Place
- 10325 Barberry Ln
- 10696 Camarelle Cir
- 11126 Oxbridge Way
- 10117 Colonial Country Club Blvd Unit 2003
- 10117 Colonial Country Club Blvd Unit 2002
- 10115 Colonial Country Club Blvd Unit 2104
- 10113 Colonial Country Club Blvd Unit 2207
- 11066 Lancewood St
- 10111 Colonial Country Club Blvd Unit 2309
- 10109 Colonial Country Club Blvd Unit 2404
- 10105 Colonial Country Club Blvd Unit 2502
- 10105 Colonial Country Club Blvd Unit 2503
- 10644 Pelican Preserve Blvd Unit 101
- 10644 Pelican Preserve Blvd Unit 102
- 11041 Yellow Poplar Dr
- 10116 Colonial Country Club Blvd Unit 306
- 10347 Carolina Willow Dr
- 11097 Yellow Poplar Dr