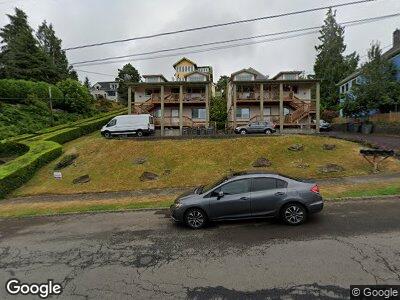
1089 Irving Ave Unit 1091 Astoria, OR 97103
Estimated Value: $842,000 - $1,199,000
8
Beds
4
Baths
768
Sq Ft
$1,404/Sq Ft
Est. Value
About This Home
This home is located at 1089 Irving Ave Unit 1091, Astoria, OR 97103 and is currently estimated at $1,078,435, approximately $1,404 per square foot. 1089 Irving Ave Unit 1091 is a home located in Clatsop County with nearby schools including Astor Elementary School, Lewis & Clark Elementary School, and Astoria Middle School.
Ownership History
Date
Name
Owned For
Owner Type
Purchase Details
Closed on
Nov 19, 2024
Sold by
Fitzpatrick Shannon and Fitzpatrick Lauri
Bought by
Farroll & Rockview Llc
Current Estimated Value
Purchase Details
Closed on
Jul 31, 2018
Sold by
1089 109 Irvign Avenue Llc
Bought by
Irving 4 Llc
Home Financials for this Owner
Home Financials are based on the most recent Mortgage that was taken out on this home.
Original Mortgage
$510,000
Interest Rate
4.6%
Mortgage Type
New Conventional
Purchase Details
Closed on
Jul 23, 2018
Sold by
Irvin 4 Llc
Bought by
Fitzpatrick Shannon and Fitzpatrick Lauri
Home Financials for this Owner
Home Financials are based on the most recent Mortgage that was taken out on this home.
Original Mortgage
$510,000
Interest Rate
4.6%
Mortgage Type
New Conventional
Create a Home Valuation Report for This Property
The Home Valuation Report is an in-depth analysis detailing your home's value as well as a comparison with similar homes in the area
Home Values in the Area
Average Home Value in this Area
Purchase History
| Date | Buyer | Sale Price | Title Company |
|---|---|---|---|
| Farroll & Rockview Llc | $1,200,000 | Ticor Title | |
| Farroll & Rockview Llc | $1,200,000 | Ticor Title | |
| Irving 4 Llc | -- | Ticor Title Co Of Orange | |
| Fitzpatrick Shannon | $680,000 | Ticor Title |
Source: Public Records
Mortgage History
| Date | Status | Borrower | Loan Amount |
|---|---|---|---|
| Previous Owner | Fitzpatrick Shannon | $510,000 |
Source: Public Records
Tax History Compared to Growth
Tax History
| Year | Tax Paid | Tax Assessment Tax Assessment Total Assessment is a certain percentage of the fair market value that is determined by local assessors to be the total taxable value of land and additions on the property. | Land | Improvement |
|---|---|---|---|---|
| 2024 | $8,626 | $431,036 | -- | -- |
| 2023 | $8,331 | $418,482 | $0 | $0 |
| 2022 | $7,873 | $406,294 | $0 | $0 |
| 2021 | $7,657 | $394,461 | $0 | $0 |
| 2020 | $7,439 | $382,973 | $0 | $0 |
| 2019 | $7,218 | $371,820 | $0 | $0 |
| 2018 | $6,639 | $360,992 | $0 | $0 |
| 2017 | $6,357 | $350,479 | $0 | $0 |
| 2016 | $6,077 | $340,272 | $101,480 | $238,792 |
| 2015 | $5,957 | $330,362 | $98,525 | $231,837 |
| 2014 | $5,849 | $320,741 | $0 | $0 |
| 2013 | -- | $311,400 | $0 | $0 |
Source: Public Records
Map
Nearby Homes
- 8 Irving St
- 736 10th St
- 8th St. Irving St
- 674 11th St
- 1243 Grand Ave
- 1219 Jerome Ave
- 1175 11th St
- 714 Harrison Ave
- 811 Franklin Ave Unit 813
- 1001 Lexington Ave
- 591 12th St
- 937 14th St
- 665 Grand Ave
- 817 Exchange St
- 884 Niagara Ave
- 509 Kensington Ave
- 570 Madison Ave
- 451 6th
- 997 16th St
- 1583 Franklin Ave