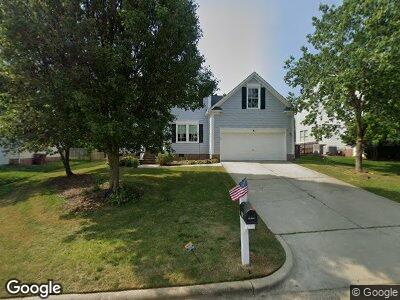
109 Calebra Way Cary, NC 27519
West Cary NeighborhoodEstimated Value: $611,000 - $699,000
4
Beds
3
Baths
2,556
Sq Ft
$252/Sq Ft
Est. Value
About This Home
This home is located at 109 Calebra Way, Cary, NC 27519 and is currently estimated at $644,769, approximately $252 per square foot. 109 Calebra Way is a home located in Wake County with nearby schools including Turner Creek Elementary School, Salem Middle, and Green Hope High.
Ownership History
Date
Name
Owned For
Owner Type
Purchase Details
Closed on
Apr 24, 2012
Sold by
Chintapalli Srinivas and Chintapalli Lavanya
Bought by
Brunetti Kenneth B and Brunetti Jennifer B
Current Estimated Value
Home Financials for this Owner
Home Financials are based on the most recent Mortgage that was taken out on this home.
Original Mortgage
$209,500
Interest Rate
4.01%
Mortgage Type
New Conventional
Purchase Details
Closed on
Aug 24, 1999
Sold by
Beazer Homes Corp
Bought by
Chintapalli Srinivas and Chintapalli Lavanya
Home Financials for this Owner
Home Financials are based on the most recent Mortgage that was taken out on this home.
Original Mortgage
$198,850
Interest Rate
7.25%
Create a Home Valuation Report for This Property
The Home Valuation Report is an in-depth analysis detailing your home's value as well as a comparison with similar homes in the area
Home Values in the Area
Average Home Value in this Area
Purchase History
| Date | Buyer | Sale Price | Title Company |
|---|---|---|---|
| Brunetti Kenneth B | $268,000 | None Available | |
| Chintapalli Srinivas | $209,500 | -- |
Source: Public Records
Mortgage History
| Date | Status | Borrower | Loan Amount |
|---|---|---|---|
| Open | Brunetti Jennifer B | $242,000 | |
| Closed | Brunetti Kenneth B | $209,500 | |
| Previous Owner | Chintapalli Srinivas | $166,601 | |
| Previous Owner | Chintapalli Srinivas | $179,200 | |
| Previous Owner | Chintapalli Srinivas | $22,500 | |
| Previous Owner | Chintapalli Srinivas | $192,000 | |
| Previous Owner | Chintapalli Srinivas | $198,850 |
Source: Public Records
Tax History Compared to Growth
Tax History
| Year | Tax Paid | Tax Assessment Tax Assessment Total Assessment is a certain percentage of the fair market value that is determined by local assessors to be the total taxable value of land and additions on the property. | Land | Improvement |
|---|---|---|---|---|
| 2024 | $4,964 | $589,582 | $210,000 | $379,582 |
| 2023 | $3,683 | $365,611 | $84,000 | $281,611 |
| 2022 | $3,546 | $365,611 | $84,000 | $281,611 |
| 2021 | $3,475 | $365,611 | $84,000 | $281,611 |
| 2020 | $3,493 | $365,611 | $84,000 | $281,611 |
| 2019 | $3,276 | $304,145 | $84,000 | $220,145 |
| 2018 | $3,075 | $304,145 | $84,000 | $220,145 |
| 2017 | $2,955 | $304,145 | $84,000 | $220,145 |
| 2016 | $2,911 | $304,145 | $84,000 | $220,145 |
| 2015 | $3,011 | $303,813 | $84,000 | $219,813 |
| 2014 | -- | $303,813 | $84,000 | $219,813 |
Source: Public Records
Map
Nearby Homes
- 2002 Patapsco Dr
- 2020 Battlewood Rd
- 117 Whitehaven Ln
- 6716 Valley Woods Ln
- 2412 Castleburg Dr
- 6824 Wood Forest Dr
- 113 Union Mills Way
- 421 Raven Cliff St
- 1215 Corkery Ridge Ct
- 213 Billingrath Turn Ln
- 1207 Corkery Ridge Ct
- 408 Torwood Cir
- 424 Hopwood Way
- 2200 Wild Apple Ct
- 1305 Holt Rd
- 207 Lewey Brook Dr
- 2310 Nutting Ln
- 103 Trent Woods Way
- 102 Stagville Ct
- 2109 Henniker St