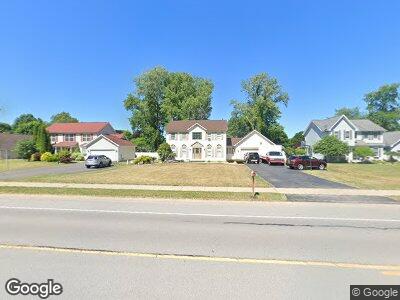
1093 Fetzner Rd Rochester, NY 14626
Estimated Value: $281,000 - $335,000
3
Beds
3
Baths
1,949
Sq Ft
$155/Sq Ft
Est. Value
About This Home
This home is located at 1093 Fetzner Rd, Rochester, NY 14626 and is currently estimated at $302,925, approximately $155 per square foot. 1093 Fetzner Rd is a home located in Monroe County with nearby schools including Greece Community Early Learning Center, Brookside Elementary School, and Olympia High School.
Ownership History
Date
Name
Owned For
Owner Type
Purchase Details
Closed on
Dec 13, 2018
Sold by
Able Export Llc
Bought by
Erol Erdal
Current Estimated Value
Home Financials for this Owner
Home Financials are based on the most recent Mortgage that was taken out on this home.
Original Mortgage
$110,000
Interest Rate
4.9%
Mortgage Type
Purchase Money Mortgage
Purchase Details
Closed on
Sep 19, 2018
Sold by
Citimortgage Inc
Bought by
Able Export Llc
Purchase Details
Closed on
May 30, 2018
Sold by
George Desmarteau Esq
Bought by
Citimortgage Inc
Purchase Details
Closed on
May 28, 2008
Sold by
Portfolio Enterprises
Bought by
Lieberman Jeremy
Home Financials for this Owner
Home Financials are based on the most recent Mortgage that was taken out on this home.
Original Mortgage
$156,700
Interest Rate
5.91%
Mortgage Type
FHA
Purchase Details
Closed on
Aug 12, 1994
Sold by
Lakeside Builders
Bought by
Sanders Mark D and Sanders Cheryl
Create a Home Valuation Report for This Property
The Home Valuation Report is an in-depth analysis detailing your home's value as well as a comparison with similar homes in the area
Home Values in the Area
Average Home Value in this Area
Purchase History
| Date | Buyer | Sale Price | Title Company |
|---|---|---|---|
| Erol Erdal | -- | Crossroads Title | |
| Able Export Llc | $140,000 | None Available | |
| Citimortgage Inc | $187,262 | None Available | |
| Lieberman Jeremy | $158,000 | -- | |
| Sanders Mark D | $143,050 | -- | |
| Lakeside Builders | $35,000 | -- |
Source: Public Records
Mortgage History
| Date | Status | Borrower | Loan Amount |
|---|---|---|---|
| Closed | Erol Erdal | $85,000 | |
| Closed | Erol Erdal | $110,000 | |
| Previous Owner | Lieberman Jeremy | $156,700 |
Source: Public Records
Tax History Compared to Growth
Tax History
| Year | Tax Paid | Tax Assessment Tax Assessment Total Assessment is a certain percentage of the fair market value that is determined by local assessors to be the total taxable value of land and additions on the property. | Land | Improvement |
|---|---|---|---|---|
| 2024 | $14,048 | $189,100 | $32,400 | $156,700 |
| 2023 | $14,048 | $189,100 | $32,400 | $156,700 |
| 2022 | $13,998 | $189,500 | $36,000 | $153,500 |
| 2021 | $13,121 | $189,500 | $36,000 | $153,500 |
| 2020 | $8,151 | $172,000 | $36,000 | $136,000 |
| 2019 | $7,865 | $172,000 | $36,000 | $136,000 |
| 2018 | $7,221 | $172,000 | $36,000 | $136,000 |
| 2017 | $3,442 | $172,000 | $36,000 | $136,000 |
| 2016 | $7,865 | $172,000 | $36,000 | $136,000 |
| 2015 | -- | $172,000 | $36,000 | $136,000 |
| 2014 | -- | $172,000 | $36,000 | $136,000 |
Source: Public Records
Map
Nearby Homes
- 45 Old Pine Ln
- 90 Kirkstone Pass
- 41 Grecian Pkwy
- 1268 Vintage Ln
- 15 Goethals Dr
- 58 Hidden Spring Cir
- 641 Vintage Ln
- 91 Barlow Dr
- 271 Courtly Cir
- 94 Alfonso Dr
- 49 Courtly Cir
- 20 Dorian Ln
- 300 Alfonso Dr
- 94 Fielding Rd
- 249 Parklands Dr
- 568 Heritage Dr
- 226 Fielding Rd
- 68 Haddon Rd
- 81 Haddon Rd
- 684 Heritage Dr