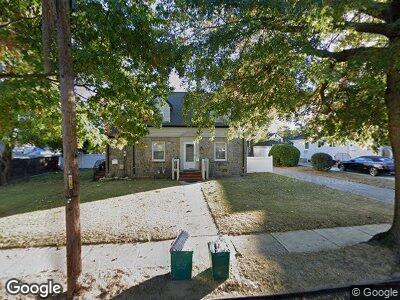
11 Duryea Place Lynbrook, NY 11563
Estimated Value: $1,029,000
5
Beds
2
Baths
1,975
Sq Ft
$521/Sq Ft
Est. Value
About This Home
This home is located at 11 Duryea Place, Lynbrook, NY 11563 and is currently estimated at $1,029,000, approximately $521 per square foot. 11 Duryea Place is a home located in Nassau County with nearby schools including Lynbrook Senior High School and Our Lady Of Peace School.
Ownership History
Date
Name
Owned For
Owner Type
Purchase Details
Closed on
Oct 13, 2023
Sold by
Shafiq Saqib
Bought by
Joseph Ghislaine and Style Sostine Jacquet
Current Estimated Value
Home Financials for this Owner
Home Financials are based on the most recent Mortgage that was taken out on this home.
Original Mortgage
$736,415
Outstanding Balance
$726,665
Interest Rate
7.18%
Mortgage Type
FHA
Estimated Equity
$289,235
Purchase Details
Closed on
Feb 28, 2019
Sold by
Ambort Trust and Deborah Schmieder Trustee
Bought by
Shafiq Saqib
Home Financials for this Owner
Home Financials are based on the most recent Mortgage that was taken out on this home.
Original Mortgage
$439,200
Interest Rate
4.4%
Mortgage Type
New Conventional
Purchase Details
Closed on
Apr 22, 2009
Sold by
Ambort Bertha
Bought by
Ambort Jan and Ambort Michael
Create a Home Valuation Report for This Property
The Home Valuation Report is an in-depth analysis detailing your home's value as well as a comparison with similar homes in the area
Home Values in the Area
Average Home Value in this Area
Purchase History
| Date | Buyer | Sale Price | Title Company |
|---|---|---|---|
| Joseph Ghislaine | $750,000 | Wall Street Abstract Corp | |
| Joseph Ghislaine | $750,000 | Wall Street Abstract Corp | |
| Shafiq Saqib | $549,000 | None Available | |
| Shafiq Saqib | $549,000 | None Available | |
| Ambort Jan | -- | Attorney | |
| Ambort Jan | -- | Attorney |
Source: Public Records
Mortgage History
| Date | Status | Borrower | Loan Amount |
|---|---|---|---|
| Open | Joseph Ghislaine | $736,415 | |
| Closed | Joseph Ghislaine | $736,415 | |
| Previous Owner | Shafiq Saqib | $439,200 |
Source: Public Records
Tax History Compared to Growth
Tax History
| Year | Tax Paid | Tax Assessment Tax Assessment Total Assessment is a certain percentage of the fair market value that is determined by local assessors to be the total taxable value of land and additions on the property. | Land | Improvement |
|---|---|---|---|---|
| 2024 | $1,104 | $516 | $233 | $283 |
| 2023 | $10,874 | $516 | $233 | $283 |
| 2022 | $10,874 | $511 | $233 | $278 |
| 2021 | $15,458 | $549 | $297 | $252 |
| 2020 | $12,005 | $781 | $527 | $254 |
| 2019 | $1,502 | $958 | $646 | $312 |
| 2018 | $1,469 | $958 | $0 | $0 |
| 2017 | $10,759 | $958 | $646 | $312 |
| 2016 | $12,144 | $958 | $646 | $312 |
| 2015 | $1,422 | $958 | $646 | $312 |
| 2014 | $1,422 | $958 | $646 | $312 |
| 2013 | $1,305 | $958 | $646 | $312 |
Source: Public Records
Map
Nearby Homes
- 2 Devon St
- 1 Devon St
- 570 Broadway Unit 10B
- 570 Broadway Unit 22B
- 570 Broadway Unit 19B
- 24 Everett St
- 596 Broadway Unit 11B
- 596 Broadway Unit 15A
- 596 Broadway Unit 29B
- 29 Everett St
- 12 Lloyd Ave
- 6 Linden Ave
- 54 Peterson Place
- 43 Evergreen Ave
- 82 Coventry Gardens
- 8 Garden Dr
- 340 Bixley Heath
- 49 Trafalgar Square
- 1737 Hancock St
- 12 Union Place