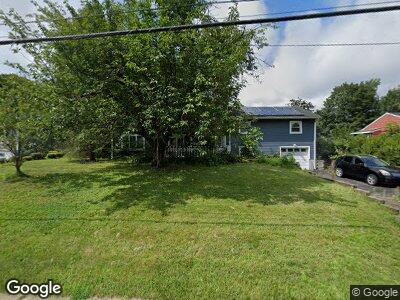
11 Saint Anne Dr New Windsor, NY 12553
New Windsor NeighborhoodEstimated Value: $467,000 - $539,000
5
Beds
3
Baths
2,668
Sq Ft
$194/Sq Ft
Est. Value
About This Home
This home is located at 11 Saint Anne Dr, New Windsor, NY 12553 and is currently estimated at $517,071, approximately $193 per square foot. 11 Saint Anne Dr is a home located in Orange County with nearby schools including Newburgh Free Academy Main Campus, San Miguel Academy Of Newburgh, and Nora Cronin Presentation Academy.
Ownership History
Date
Name
Owned For
Owner Type
Purchase Details
Closed on
Feb 17, 2016
Sold by
Northern Enterprsie Ny Llc
Bought by
Kenny Michael and Kenny Angelo
Current Estimated Value
Home Financials for this Owner
Home Financials are based on the most recent Mortgage that was taken out on this home.
Original Mortgage
$222,323
Outstanding Balance
$178,918
Interest Rate
3.75%
Mortgage Type
FHA
Estimated Equity
$338,153
Purchase Details
Closed on
Aug 19, 2015
Sold by
Mele John & Mele Caryn By David
Bought by
Northern Enterprise Ny Llc
Purchase Details
Closed on
May 20, 1999
Sold by
Lundgren Gary T and Lundgren Eileen A
Bought by
Mele John and Mele Caryn
Home Financials for this Owner
Home Financials are based on the most recent Mortgage that was taken out on this home.
Original Mortgage
$103,000
Interest Rate
6.82%
Create a Home Valuation Report for This Property
The Home Valuation Report is an in-depth analysis detailing your home's value as well as a comparison with similar homes in the area
Home Values in the Area
Average Home Value in this Area
Purchase History
| Date | Buyer | Sale Price | Title Company |
|---|---|---|---|
| Kenny Michael | $230,000 | Richard Forbes | |
| Northern Enterprise Ny Llc | $132,900 | -- | |
| Mele John | $122,000 | -- |
Source: Public Records
Mortgage History
| Date | Status | Borrower | Loan Amount |
|---|---|---|---|
| Open | Kenny Michael | $222,323 | |
| Previous Owner | Lundgren Gary T | $43,000 | |
| Previous Owner | Lundgren Gary T | $42,700 | |
| Previous Owner | Lundgren Gary T | $25,000 | |
| Previous Owner | Mele John | $103,000 | |
| Previous Owner | Lundgren Gary T | $27,389 |
Source: Public Records
Tax History Compared to Growth
Tax History
| Year | Tax Paid | Tax Assessment Tax Assessment Total Assessment is a certain percentage of the fair market value that is determined by local assessors to be the total taxable value of land and additions on the property. | Land | Improvement |
|---|---|---|---|---|
| 2023 | $10,177 | $45,000 | $8,400 | $36,600 |
| 2022 | $10,359 | $45,000 | $8,400 | $36,600 |
| 2021 | $10,337 | $45,000 | $8,400 | $36,600 |
| 2020 | $10,155 | $45,000 | $8,400 | $36,600 |
| 2019 | $3,404 | $45,000 | $8,400 | $36,600 |
| 2018 | $3,404 | $45,000 | $8,400 | $36,600 |
| 2017 | $10,053 | $45,000 | $8,400 | $36,600 |
| 2016 | $9,084 | $45,000 | $8,400 | $36,600 |
| 2015 | -- | $48,700 | $6,900 | $41,800 |
| 2014 | -- | $48,700 | $6,900 | $41,800 |
Source: Public Records
Map
Nearby Homes
- 10 Oakwood Terrace Unit 56
- 10 Oakwood Terrace Unit 120
- 10 Oakwood Terrace Unit 85
- 211 Butter Hill Dr
- 51 Guernsey Dr
- 9 Louise Dr
- 67 Harth Dr
- 19 Creamery Dr
- 243 Garden St
- 42 Creamery Dr
- 28 Garden Dr
- 246 Parkway Dr
- 8 Jay St
- 233 Daniher Ave
- 6 Staples Ln
- 8 Canterbury Ln
- 43 Kenwood Dr Unit 3
- 6 Barclay Rd
- 4008 Thomas Paine Way
- 1121 Washington Green