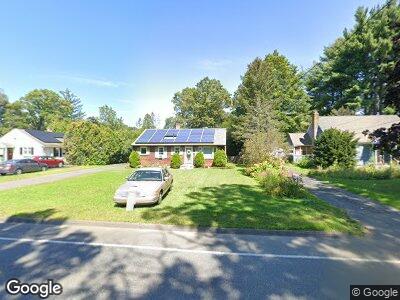
110 Bridge Rd Florence, MA 01062
Leeds NeighborhoodEstimated Value: $325,147 - $397,000
3
Beds
2
Baths
988
Sq Ft
$365/Sq Ft
Est. Value
About This Home
This home is located at 110 Bridge Rd, Florence, MA 01062 and is currently estimated at $360,287, approximately $364 per square foot. 110 Bridge Rd is a home located in Hampshire County with nearby schools including Northampton High School, The Montessori School of Northampton, and Lander Grinspoon Academy.
Ownership History
Date
Name
Owned For
Owner Type
Purchase Details
Closed on
Aug 2, 2023
Sold by
Kelley Alice M
Bought by
Kelley Jonathan N and Kelley Katie J
Current Estimated Value
Home Financials for this Owner
Home Financials are based on the most recent Mortgage that was taken out on this home.
Original Mortgage
$250,000
Outstanding Balance
$245,873
Interest Rate
6.67%
Mortgage Type
Commercial
Estimated Equity
$114,414
Purchase Details
Closed on
Sep 30, 2011
Sold by
Kelley Phillip R and Kelley Alice M
Bought by
Kelley Phillip R and Kelley Alice M
Home Financials for this Owner
Home Financials are based on the most recent Mortgage that was taken out on this home.
Original Mortgage
$330,000
Interest Rate
4.15%
Mortgage Type
Reverse Mortgage Home Equity Conversion Mortgage
Purchase Details
Closed on
Oct 30, 2009
Sold by
Westort Veralyn A
Bought by
Kelley Phillip R and Kelley Alice M
Home Financials for this Owner
Home Financials are based on the most recent Mortgage that was taken out on this home.
Original Mortgage
$120,000
Interest Rate
5.06%
Mortgage Type
Purchase Money Mortgage
Create a Home Valuation Report for This Property
The Home Valuation Report is an in-depth analysis detailing your home's value as well as a comparison with similar homes in the area
Home Values in the Area
Average Home Value in this Area
Purchase History
| Date | Buyer | Sale Price | Title Company |
|---|---|---|---|
| Kelley Jonathan N | $312,500 | None Available | |
| Kelley Phillip R | -- | -- | |
| Kelley Phillip R | $213,000 | -- |
Source: Public Records
Mortgage History
| Date | Status | Borrower | Loan Amount |
|---|---|---|---|
| Open | Kelley Jonathan N | $250,000 | |
| Previous Owner | Kelley Phillip R | $330,000 | |
| Previous Owner | Kelley Phillip R | $120,000 |
Source: Public Records
Tax History Compared to Growth
Tax History
| Year | Tax Paid | Tax Assessment Tax Assessment Total Assessment is a certain percentage of the fair market value that is determined by local assessors to be the total taxable value of land and additions on the property. | Land | Improvement |
|---|---|---|---|---|
| 2024 | $4,346 | $286,100 | $122,200 | $163,900 |
| 2023 | $4,087 | $258,000 | $111,100 | $146,900 |
| 2022 | $4,068 | $227,400 | $111,100 | $116,300 |
| 2021 | $3,559 | $204,900 | $106,100 | $98,800 |
| 2020 | $3,442 | $204,900 | $106,100 | $98,800 |
| 2019 | $3,208 | $184,700 | $91,100 | $93,600 |
| 2018 | $3,186 | $187,000 | $91,100 | $95,900 |
| 2017 | $3,121 | $187,000 | $91,100 | $95,900 |
| 2016 | $3,022 | $187,000 | $91,100 | $95,900 |
| 2015 | $2,931 | $185,500 | $91,100 | $94,400 |
| 2014 | $2,855 | $185,500 | $91,100 | $94,400 |
Source: Public Records
Map
Nearby Homes
- 20 Bridge Rd Unit 13
- 66 Fox Farms Rd
- 67 Park St Unit D
- 310 Fairway Village Unit 310
- 305 Locust St
- 267 Locust St Unit 2M
- 152 S Main St Unit 4
- 152 S Main St Unit 6
- 152 S Main St Unit 8
- 152 S Main St Unit 7
- 152 S Main St Unit 5
- 575 Bridge Rd Unit 9-6
- 279 Haydenville Rd
- 0 Haydenville Rd
- 497 Riverside Dr
- 191 Main St
- 47 Winslow Ave
- 60 Norwood Ave
- 65 Warner St
- 110 Cooke Ave