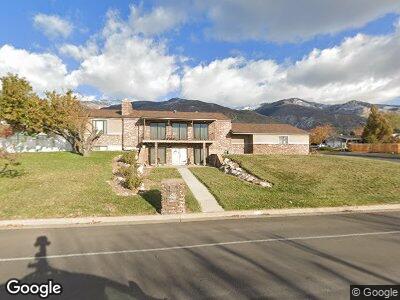
110 N Country Ln Kaysville, UT 84037
Fruit Heights NeighborhoodEstimated Value: $608,125 - $710,000
5
Beds
4
Baths
2,195
Sq Ft
$304/Sq Ft
Est. Value
About This Home
This home is located at 110 N Country Ln, Kaysville, UT 84037 and is currently estimated at $666,781, approximately $303 per square foot. 110 N Country Ln is a home located in Davis County with nearby schools including H.C. Burton Elementary School, Kaysville Junior High School, and Davis High School.
Ownership History
Date
Name
Owned For
Owner Type
Purchase Details
Closed on
Sep 26, 2011
Sold by
Schramm Max B and Schramm Kelly M
Bought by
Schramm Max B and Schramm Kelly M
Current Estimated Value
Home Financials for this Owner
Home Financials are based on the most recent Mortgage that was taken out on this home.
Original Mortgage
$141,400
Outstanding Balance
$21,370
Interest Rate
3.39%
Mortgage Type
New Conventional
Estimated Equity
$667,366
Purchase Details
Closed on
Oct 11, 2010
Sold by
Schramm Max B and Schramm Kelly M
Bought by
Schramm Max B and Schramm Kelly M
Home Financials for this Owner
Home Financials are based on the most recent Mortgage that was taken out on this home.
Original Mortgage
$142,000
Interest Rate
4.27%
Mortgage Type
New Conventional
Purchase Details
Closed on
Oct 24, 2006
Sold by
Schramm Max B and Schramm Kelly M
Bought by
Schramm Max B and Schramm Kelly M
Purchase Details
Closed on
Jan 12, 1998
Sold by
Williams Ariel L and Williams Helen G
Bought by
Schramm Max B and Schramm Kelly M
Create a Home Valuation Report for This Property
The Home Valuation Report is an in-depth analysis detailing your home's value as well as a comparison with similar homes in the area
Home Values in the Area
Average Home Value in this Area
Purchase History
| Date | Buyer | Sale Price | Title Company |
|---|---|---|---|
| Schramm Max B | -- | First American Title | |
| Schramm Max B | -- | First American Title | |
| Schramm Max B | -- | Accommodation | |
| Schramm Max B | -- | First American Title | |
| Schramm Max B | -- | None Available | |
| Schramm Max B | -- | None Available | |
| Schramm Max B | $1,000 | -- |
Source: Public Records
Mortgage History
| Date | Status | Borrower | Loan Amount |
|---|---|---|---|
| Open | Schramm Max B | $141,400 | |
| Closed | Schramm Max B | $50,000 | |
| Closed | Schramm Max B | $142,000 | |
| Closed | Schramm Max B | $30,000 |
Source: Public Records
Tax History Compared to Growth
Tax History
| Year | Tax Paid | Tax Assessment Tax Assessment Total Assessment is a certain percentage of the fair market value that is determined by local assessors to be the total taxable value of land and additions on the property. | Land | Improvement |
|---|---|---|---|---|
| 2024 | $3,419 | $350,350 | $255,209 | $95,141 |
| 2023 | $3,323 | $617,000 | $393,586 | $223,414 |
| 2022 | $3,521 | $356,950 | $201,726 | $155,224 |
| 2021 | $3,172 | $486,000 | $313,003 | $172,997 |
| 2020 | $2,877 | $427,000 | $267,308 | $159,692 |
| 2019 | $2,852 | $418,000 | $241,972 | $176,028 |
| 2018 | $2,713 | $392,000 | $166,969 | $225,031 |
| 2016 | $2,614 | $196,736 | $73,002 | $123,734 |
| 2015 | $2,558 | $183,096 | $73,002 | $110,094 |
| 2014 | $2,736 | $178,201 | $73,002 | $105,199 |
| 2013 | -- | $161,744 | $53,381 | $108,363 |
Source: Public Records
Map
Nearby Homes
- 10 S Country Ln
- 1011 Brook Haven Dr
- 1491 N Orchard Ln
- 1012 E Green Rd
- 214 N Mountain Rd
- 1779 250 N Unit 29-R
- 1730 250 N Unit 23-R
- 1616 250 N Unit 26-R
- 656 E 100 S
- 294 S 850 E
- 95 S 600 E
- 868 E 350 S
- 511 S Brushy Ridge Way
- 532 Happy Hollow Ln
- 897 E Fence Post Rd
- 734 E Brookshire Hollow Dr
- 362 Glen Cir
- 397 E 200 N
- 805 N Brookshire Dr
- 884 E Fence Post Rd