1100 51st St NE Washington, DC 20019
Deanwood NeighborhoodEstimated Value: $408,000 - $520,709
5
Beds
3
Baths
2,124
Sq Ft
$216/Sq Ft
Est. Value
About This Home
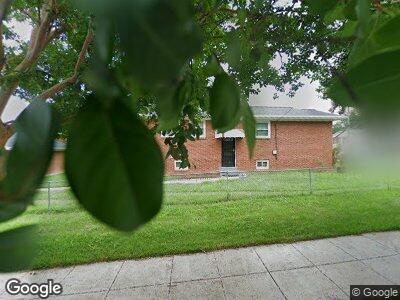
This home is located at 1100 51st St NE, Washington, DC 20019 and is currently estimated at $458,677, approximately $215 per square foot. 1100 51st St NE is a home located in District of Columbia with nearby schools including Houston Elementary School, Kelly Miller Middle School, and H.D. Woodson High School.
Ownership History
Date
Name
Owned For
Owner Type
Purchase Details
Closed on
Dec 12, 2018
Sold by
Selene Finance Lp
Bought by
Sankurathri Prakash
Current Estimated Value
Home Financials for this Owner
Home Financials are based on the most recent Mortgage that was taken out on this home.
Original Mortgage
$179,025
Outstanding Balance
$159,849
Interest Rate
4.8%
Mortgage Type
Commercial
Estimated Equity
$287,941
Purchase Details
Closed on
Jan 15, 2008
Sold by
Cunningham Carmen
Bought by
Coley Antonio A
Home Financials for this Owner
Home Financials are based on the most recent Mortgage that was taken out on this home.
Original Mortgage
$350,000
Interest Rate
6.17%
Mortgage Type
New Conventional
Purchase Details
Closed on
Jun 29, 2007
Sold by
Norris Crystal
Bought by
Cunningham Carmen
Home Financials for this Owner
Home Financials are based on the most recent Mortgage that was taken out on this home.
Original Mortgage
$267,000
Interest Rate
6.48%
Mortgage Type
New Conventional
Create a Home Valuation Report for This Property
The Home Valuation Report is an in-depth analysis detailing your home's value as well as a comparison with similar homes in the area
Home Values in the Area
Average Home Value in this Area
Purchase History
| Date | Buyer | Sale Price | Title Company |
|---|---|---|---|
| Sankurathri Prakash | $238,700 | First Class Title Inc | |
| Coley Antonio A | $350,000 | -- | |
| Cunningham Carmen | $267,000 | -- |
Source: Public Records
Mortgage History
| Date | Status | Borrower | Loan Amount |
|---|---|---|---|
| Open | Sankurathri Prakash | $179,025 | |
| Previous Owner | Coley Antonio A | $350,000 | |
| Previous Owner | Cunningham Carmen | $267,000 |
Source: Public Records
Tax History Compared to Growth
Tax History
| Year | Tax Paid | Tax Assessment Tax Assessment Total Assessment is a certain percentage of the fair market value that is determined by local assessors to be the total taxable value of land and additions on the property. | Land | Improvement |
|---|---|---|---|---|
| 2024 | $3,496 | $411,290 | $153,580 | $257,710 |
| 2023 | $3,362 | $395,500 | $150,190 | $245,310 |
| 2022 | $3,033 | $356,780 | $146,710 | $210,070 |
| 2021 | $2,891 | $340,120 | $144,550 | $195,570 |
| 2020 | $2,785 | $327,620 | $139,550 | $188,070 |
| 2019 | $2,552 | $300,280 | $135,570 | $164,710 |
| 2018 | $2,454 | $288,700 | $0 | $0 |
| 2017 | $2,294 | $269,870 | $0 | $0 |
| 2016 | $2,053 | $241,530 | $0 | $0 |
| 2015 | $1,846 | $217,140 | $0 | $0 |
| 2014 | $1,716 | $201,880 | $0 | $0 |
Source: Public Records
Map
Nearby Homes
- 1112 51st Place NE
- 1107 Booth Ln
- 926 52nd St NE
- 5044 Meade St NE
- 5106 Just St NE
- 5102 Just St NE
- 5042 Meade St NE
- 5020 Meade St NE
- 5063 Sheriff Rd NE
- 5064 Just St NE
- 5302 Sheriff Rd
- 5304 Sheriff Rd
- 1303 Eastern Ave
- 5033 Just St NE Unit 5035
- 948 Eastern Ave NE Unit 3
- 1023 49th Place NE
- 1304 Doewood Ln
- 0 50th and Jay Ne (Use 5015 Jay St Ne To Locate) St NE Unit DCDC2174254
- 4810 Leroy Gorham Dr
- 846 50th Place NE