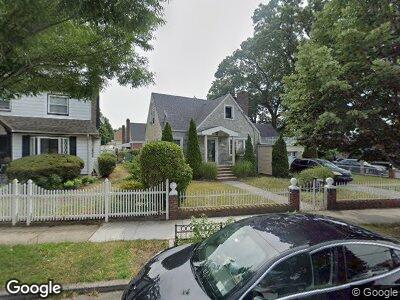
11015 223rd St Queens Village, NY 11429
Queens Village NeighborhoodEstimated Value: $711,758 - $828,000
--
Bed
--
Bath
1,194
Sq Ft
$638/Sq Ft
Est. Value
About This Home
This home is located at 11015 223rd St, Queens Village, NY 11429 and is currently estimated at $761,940, approximately $638 per square foot. 11015 223rd St is a home located in Queens County with nearby schools including P.S./M.S. 147 Ronald Mcnair, I.S. 192 The Linden, and Ss Joachim & Anne School.
Ownership History
Date
Name
Owned For
Owner Type
Purchase Details
Closed on
Jun 16, 2022
Sold by
Scott Gladston
Bought by
Allen Charmaine
Current Estimated Value
Purchase Details
Closed on
Jun 24, 2019
Sold by
Scott Gladston
Bought by
Scott Gladston and Tyrell-Carr Theresa
Purchase Details
Closed on
Apr 8, 2004
Sold by
Huggins Albertha and Scott Gladston
Bought by
Scott Gladston
Home Financials for this Owner
Home Financials are based on the most recent Mortgage that was taken out on this home.
Original Mortgage
$308,000
Interest Rate
5.4%
Purchase Details
Closed on
Jul 18, 1994
Sold by
Mitchell Joseph
Bought by
Huggins Albertha and Scott Gladston
Home Financials for this Owner
Home Financials are based on the most recent Mortgage that was taken out on this home.
Original Mortgage
$145,800
Interest Rate
8.44%
Create a Home Valuation Report for This Property
The Home Valuation Report is an in-depth analysis detailing your home's value as well as a comparison with similar homes in the area
Home Values in the Area
Average Home Value in this Area
Purchase History
| Date | Buyer | Sale Price | Title Company |
|---|---|---|---|
| Allen Charmaine | -- | -- | |
| Allen Charmaine | -- | -- | |
| Scott Gladston | -- | -- | |
| Scott Gladston | -- | -- | |
| Scott Gladston | -- | -- | |
| Scott Gladston | -- | -- |
Source: Public Records
Mortgage History
| Date | Status | Borrower | Loan Amount |
|---|---|---|---|
| Previous Owner | Scott Gladston | $308,000 | |
| Previous Owner | Huggins Albertha | $225,000 | |
| Previous Owner | Huggins Albertha | $145,800 | |
| Closed | Scott Gladston | $0 |
Source: Public Records
Tax History Compared to Growth
Tax History
| Year | Tax Paid | Tax Assessment Tax Assessment Total Assessment is a certain percentage of the fair market value that is determined by local assessors to be the total taxable value of land and additions on the property. | Land | Improvement |
|---|---|---|---|---|
| 2024 | $7,276 | $36,228 | $14,063 | $22,165 |
| 2023 | $6,942 | $34,180 | $14,711 | $19,469 |
| 2022 | $6,437 | $39,420 | $16,140 | $23,280 |
| 2021 | $6,786 | $37,320 | $16,140 | $21,180 |
| 2020 | $6,773 | $35,160 | $16,140 | $19,020 |
| 2019 | $6,315 | $38,760 | $16,140 | $22,620 |
| 2018 | $5,806 | $28,483 | $13,489 | $14,994 |
| 2017 | $5,478 | $26,872 | $15,059 | $11,813 |
| 2016 | $5,372 | $26,872 | $15,059 | $11,813 |
| 2015 | $3,058 | $26,667 | $14,411 | $12,256 |
| 2014 | $3,058 | $25,159 | $15,107 | $10,052 |
Source: Public Records
Map
Nearby Homes
- 223-23 109th Ave
- 109-11 225th St
- 109-15 221st St
- 109-20 221st St
- 225-19 109th Ave
- 108-05 221st St
- 108-17 221st St
- 223-12 107th Ave
- 221-36 107th Ave
- 22016 108th Ave
- 227-02 112th Rd
- 225-23 Murdock Ave
- 221-36 Murdock Ave
- 107-13 220th St
- 107-9 220th St
- 108-02 220th St
- 22514 Murdock Ave
- 225-53 Murdock Ave
- 223-45 113th Dr
- 21918 107th Ave