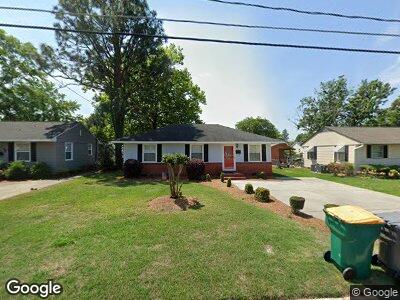
1106 E 11th St Lumberton, NC 28358
Godwin Heights NeighborhoodEstimated Value: $94,524 - $135,000
3
Beds
1
Bath
1,344
Sq Ft
$90/Sq Ft
Est. Value
About This Home
This home is located at 1106 E 11th St, Lumberton, NC 28358 and is currently estimated at $120,631, approximately $89 per square foot. 1106 E 11th St is a home located in Robeson County with nearby schools including Rowland Norment Elementary School, Parkton Elementary School, and L. Gilbert Carroll Middle School.
Ownership History
Date
Name
Owned For
Owner Type
Purchase Details
Closed on
Jun 11, 2020
Sold by
Brown Stacy
Bought by
Brown Shane
Current Estimated Value
Purchase Details
Closed on
Aug 4, 2014
Sold by
L & B Properties Of Lumberton Llc
Bought by
Brown Shane Michael
Home Financials for this Owner
Home Financials are based on the most recent Mortgage that was taken out on this home.
Original Mortgage
$91,224
Interest Rate
4.24%
Mortgage Type
New Conventional
Purchase Details
Closed on
Nov 26, 2013
Sold by
Stone Charles and Stone Norma I
Bought by
L & B Properties Of Lumberton Llc
Purchase Details
Closed on
Jan 31, 2005
Sold by
Cummings Dorothy Fields
Bought by
Cummings Dorothy Fields and Fagan Dorothy
Home Financials for this Owner
Home Financials are based on the most recent Mortgage that was taken out on this home.
Original Mortgage
$64,600
Interest Rate
11.99%
Mortgage Type
Adjustable Rate Mortgage/ARM
Create a Home Valuation Report for This Property
The Home Valuation Report is an in-depth analysis detailing your home's value as well as a comparison with similar homes in the area
Home Values in the Area
Average Home Value in this Area
Purchase History
| Date | Buyer | Sale Price | Title Company |
|---|---|---|---|
| Brown Shane | -- | None Available | |
| Brown Shane Michael | $89,500 | None Available | |
| L & B Properties Of Lumberton Llc | $35,000 | None Available | |
| Cummings Dorothy Fields | -- | -- |
Source: Public Records
Mortgage History
| Date | Status | Borrower | Loan Amount |
|---|---|---|---|
| Open | Brown Shane | $83,000 | |
| Closed | Brown Shane Michael | $91,224 | |
| Previous Owner | Stone Ii Charles S | $39,000 | |
| Previous Owner | Cummings Dorothy Fields | $64,600 |
Source: Public Records
Tax History Compared to Growth
Tax History
| Year | Tax Paid | Tax Assessment Tax Assessment Total Assessment is a certain percentage of the fair market value that is determined by local assessors to be the total taxable value of land and additions on the property. | Land | Improvement |
|---|---|---|---|---|
| 2024 | $667 | $78,900 | $11,600 | $67,300 |
| 2023 | $477 | $53,500 | $10,500 | $43,000 |
| 2022 | $477 | $53,500 | $10,500 | $43,000 |
| 2021 | $477 | $53,500 | $10,500 | $43,000 |
| 2020 | $463 | $53,500 | $10,500 | $43,000 |
| 2018 | $472 | $52,000 | $12,600 | $39,400 |
| 2017 | $460 | $52,000 | $12,600 | $39,400 |
| 2016 | $460 | $52,000 | $12,600 | $39,400 |
| 2015 | $460 | $52,000 | $12,600 | $39,400 |
| 2014 | $460 | $52,000 | $12,600 | $39,400 |
Source: Public Records