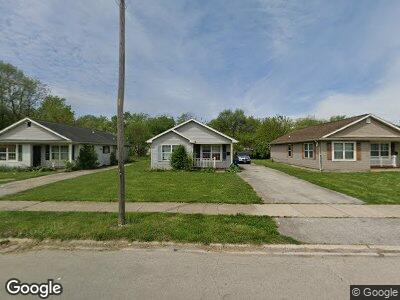
1106 Seeley Ave Chicago Heights, IL 60411
Ford Heights NeighborhoodEstimated Value: $90,000 - $124,000
3
Beds
1
Bath
1,202
Sq Ft
$85/Sq Ft
Est. Value
About This Home
This home is located at 1106 Seeley Ave, Chicago Heights, IL 60411 and is currently estimated at $102,626, approximately $85 per square foot. 1106 Seeley Ave is a home located in Cook County with nearby schools including Cottage Grove Upper Grade Center, Bloom Trail High School, and St Agnes School.
Ownership History
Date
Name
Owned For
Owner Type
Purchase Details
Closed on
Jun 10, 2015
Sold by
Person Sarah
Bought by
Howe Cheryl L and Rabe Richard C
Current Estimated Value
Purchase Details
Closed on
May 28, 2008
Sold by
Rabe Richard C
Bought by
Fam Investment Group Llc
Purchase Details
Closed on
Dec 21, 2007
Sold by
Us Bank Na
Bought by
Rabe Richard C
Purchase Details
Closed on
May 31, 2007
Sold by
Chinn Kenneth
Bought by
Us Bank Na
Purchase Details
Closed on
Sep 8, 2005
Sold by
Chicago Childrens Youth & Senior Citizen
Bought by
Chinn Kenneth and Chinn Chevelle
Home Financials for this Owner
Home Financials are based on the most recent Mortgage that was taken out on this home.
Original Mortgage
$104,000
Interest Rate
6.47%
Mortgage Type
Unknown
Purchase Details
Closed on
Jul 23, 2004
Sold by
Village Of Ford Heights
Bought by
Chicago Childrens Youth & Senior Citizen
Create a Home Valuation Report for This Property
The Home Valuation Report is an in-depth analysis detailing your home's value as well as a comparison with similar homes in the area
Home Values in the Area
Average Home Value in this Area
Purchase History
| Date | Buyer | Sale Price | Title Company |
|---|---|---|---|
| Howe Cheryl L | -- | None Available | |
| Fam Investment Group Llc | -- | None Available | |
| Rabe Richard C | $33,500 | First American Title | |
| Us Bank Na | -- | None Available | |
| Chinn Kenneth | $130,000 | -- | |
| Chicago Childrens Youth & Senior Citizen | -- | -- |
Source: Public Records
Mortgage History
| Date | Status | Borrower | Loan Amount |
|---|---|---|---|
| Previous Owner | Rabe Richard C | $37,600 | |
| Previous Owner | Chinn Kenneth | $104,000 | |
| Previous Owner | Chinn Kenneth | $26,000 |
Source: Public Records
Tax History Compared to Growth
Tax History
| Year | Tax Paid | Tax Assessment Tax Assessment Total Assessment is a certain percentage of the fair market value that is determined by local assessors to be the total taxable value of land and additions on the property. | Land | Improvement |
|---|---|---|---|---|
| 2024 | $2,658 | $3,237 | $833 | $2,404 |
| 2023 | $2,658 | $3,237 | $833 | $2,404 |
| 2022 | $2,658 | $2,959 | $833 | $2,126 |
| 2021 | $2,482 | $2,957 | $832 | $2,125 |
| 2020 | $2,690 | $2,957 | $832 | $2,125 |
| 2019 | $2,352 | $2,493 | $693 | $1,800 |
| 2018 | $2,257 | $2,493 | $693 | $1,800 |
| 2017 | $2,539 | $2,493 | $693 | $1,800 |
| 2016 | $2,848 | $2,633 | $555 | $2,078 |
| 2015 | $2,668 | $2,633 | $555 | $2,078 |
| 2014 | $2,759 | $2,633 | $555 | $2,078 |
| 2013 | -- | $3,115 | $555 | $2,560 |
Source: Public Records
Map
Nearby Homes
- 1023 Cottage Grove Ave
- Lot 1 Chicago Rd
- 1444 Park Ln
- 1449 Park Ln
- 1529 Ambassador Ln
- 1521 E 13th Place
- 1415 E 15th Place
- 1750 E Joe Orr Rd
- 19758 Stoney Island Ave
- 2001 E Lincoln Hwy
- 1752 E Joe Orr Rd
- 21668 Peterson Ave
- 2221 Rush St
- 2220 Astor St
- 2247 Astor St
- 1158 Stone Ln
- 1154 Stone Ln
- 21640 Olivia Ave
- 21760 Peterson Ave
- 21733 Carol Ave