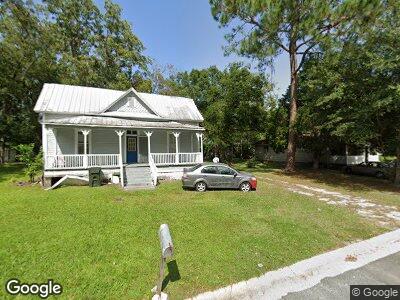
1108 Ann St Waycross, GA 31503
Estimated Value: $39,000 - $115,032
3
Beds
2
Baths
1,299
Sq Ft
$71/Sq Ft
Est. Value
About This Home
This home is located at 1108 Ann St, Waycross, GA 31503 and is currently estimated at $91,758, approximately $70 per square foot. 1108 Ann St is a home located in Ware County with nearby schools including Ruskin Elementary School, Ware County Middle School, and Ware County High School.
Ownership History
Date
Name
Owned For
Owner Type
Purchase Details
Closed on
Mar 20, 2024
Sold by
Bright Peach Llc
Bought by
Reid Michael A and Reid Naomie
Current Estimated Value
Purchase Details
Closed on
Apr 8, 2020
Sold by
Strickland Rental Properties Llc
Bought by
Bright Peach Llc
Purchase Details
Closed on
Nov 30, 2015
Sold by
King Ruby L
Bought by
Strickland Rental Properties L
Purchase Details
Closed on
Aug 30, 2007
Sold by
Tolbert John
Bought by
King Ruby L
Home Financials for this Owner
Home Financials are based on the most recent Mortgage that was taken out on this home.
Original Mortgage
$19,538
Interest Rate
6.62%
Mortgage Type
FHA
Purchase Details
Closed on
Jun 1, 2005
Sold by
Lee Emanuel
Bought by
Tolbert John
Purchase Details
Closed on
Oct 24, 2002
Sold by
Welch Ralph J
Bought by
Lee Emanuel and Lee Freddy
Purchase Details
Closed on
Jun 17, 1985
Create a Home Valuation Report for This Property
The Home Valuation Report is an in-depth analysis detailing your home's value as well as a comparison with similar homes in the area
Home Values in the Area
Average Home Value in this Area
Purchase History
| Date | Buyer | Sale Price | Title Company |
|---|---|---|---|
| Reid Michael A | $35,000 | -- | |
| Bright Peach Llc | $20,000 | -- | |
| Strickland Rental Properties L | $18,000 | -- | |
| King Ruby L | $25,000 | -- | |
| Tolbert John | $8,000 | -- | |
| Lee Emanuel | -- | -- | |
| -- | $5,000 | -- |
Source: Public Records
Mortgage History
| Date | Status | Borrower | Loan Amount |
|---|---|---|---|
| Previous Owner | King Ruby L | $19,538 |
Source: Public Records
Tax History Compared to Growth
Tax History
| Year | Tax Paid | Tax Assessment Tax Assessment Total Assessment is a certain percentage of the fair market value that is determined by local assessors to be the total taxable value of land and additions on the property. | Land | Improvement |
|---|---|---|---|---|
| 2024 | $473 | $13,722 | $1,258 | $12,464 |
| 2023 | $473 | $14,812 | $892 | $13,920 |
| 2022 | $590 | $14,812 | $892 | $13,920 |
| 2021 | $346 | $10,308 | $892 | $9,416 |
| 2020 | $442 | $10,132 | $892 | $9,240 |
| 2019 | $428 | $9,692 | $892 | $8,800 |
| 2018 | $413 | $9,252 | $892 | $8,360 |
| 2017 | $314 | $9,252 | $892 | $8,360 |
| 2016 | $314 | $10,088 | $892 | $9,196 |
| 2015 | -- | $9,760 | $565 | $9,196 |
| 2014 | -- | $9,761 | $565 | $9,196 |
| 2013 | -- | $9,468 | $564 | $8,903 |
Source: Public Records
Map
Nearby Homes
- 904 Elizabeth St
- 803 Bertha St
- 801 Bertha St
- 807 Elizabeth St
- 803 Elizabeth St
- 503 N Nicholls St
- 0 S Georgia Pkwy W
- 505 N Nicholls St
- 1322 Jane St
- 506 Ware St
- 1303 Carswell Ave
- 506 McDonald St
- 605 Walker St
- 1401 Carswell Ave
- 0 Camp Branch Cross Rd Unit 147575
- 0 Camp Branch Cross Rd Unit 10127958
- 1407 Pine St
- 617 Ware St
- 1009 Johanna St
- 1503 Carswell Ave